Grant funding data 2019 to 2020
Grant funding data 2019 to 2020.
This report provides data on the grants we've funded over the past year and funding trends for the past five years.
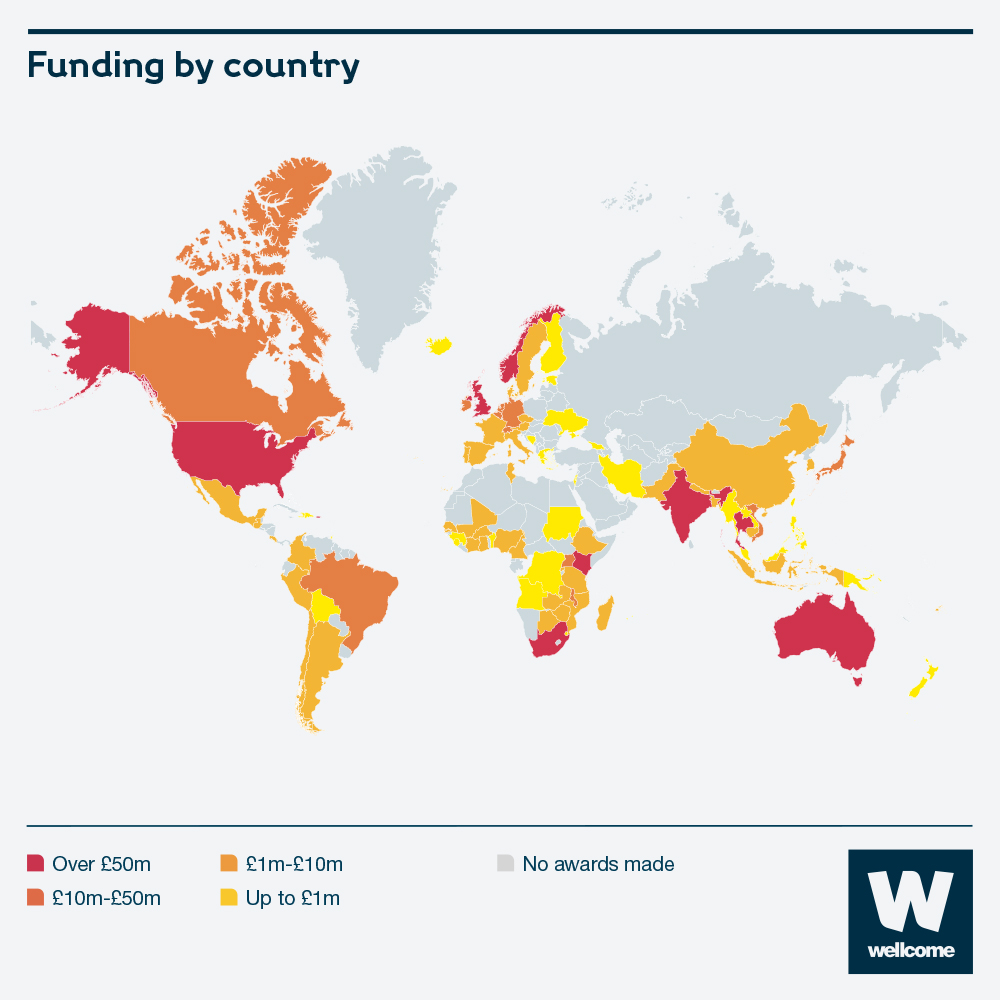
It includes the number and value of awards in our current grant portfolio, application and award rates, and who we've funded and where.
- Facts and figures on our grant funding and grant recipients for the period 1 October 2019 to 30 September 2020
- Funding trends over the past five years.
- Anyone interested in what Wellcome spends on grant activities and who receives Wellcome funding
- Researchers and research office staff.
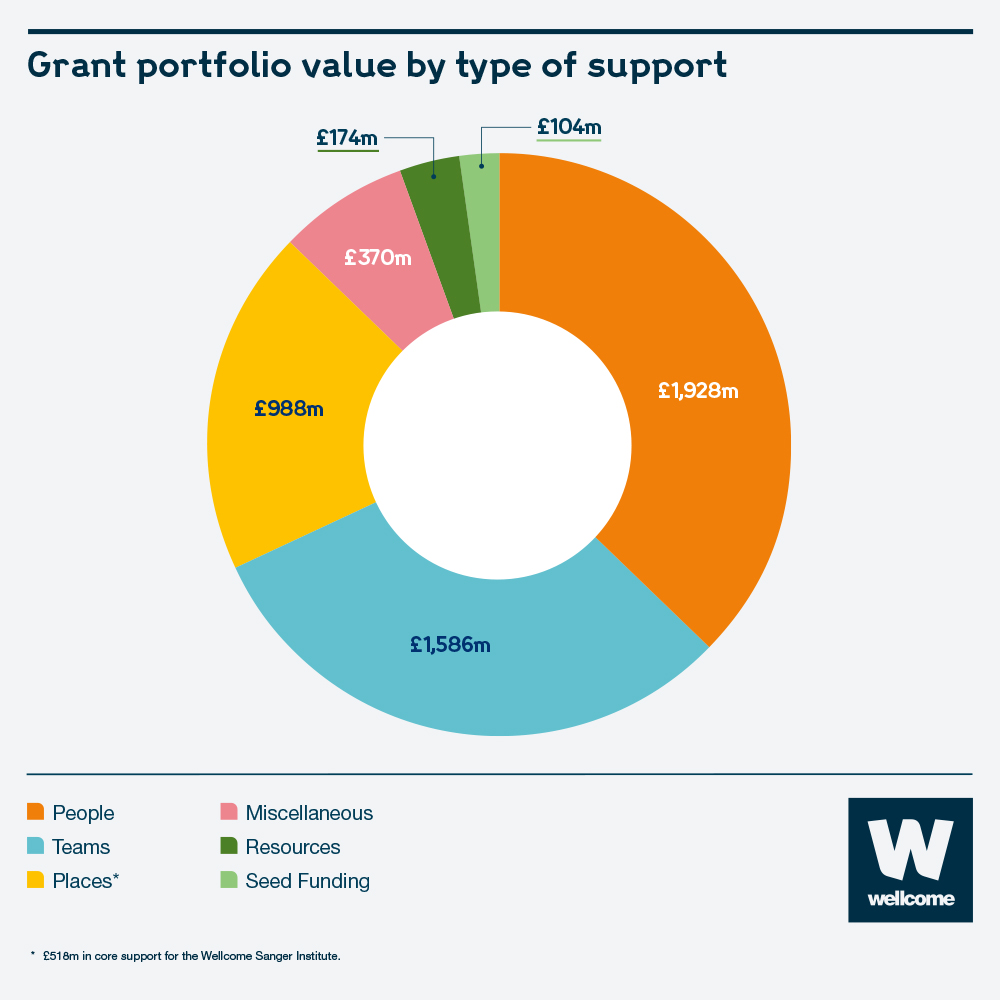
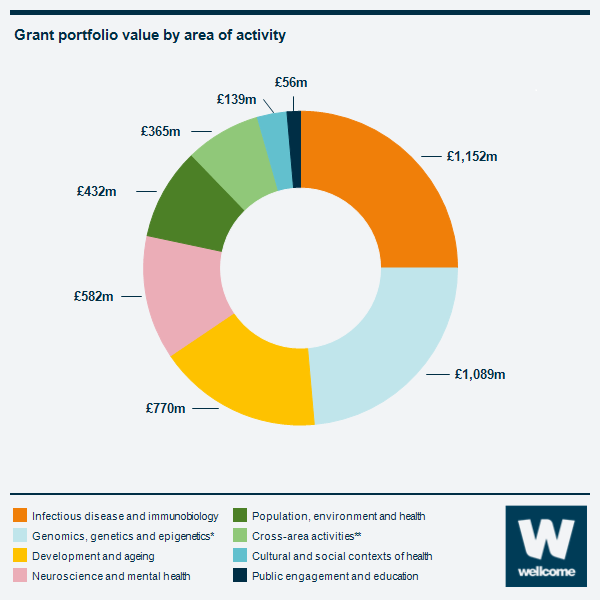
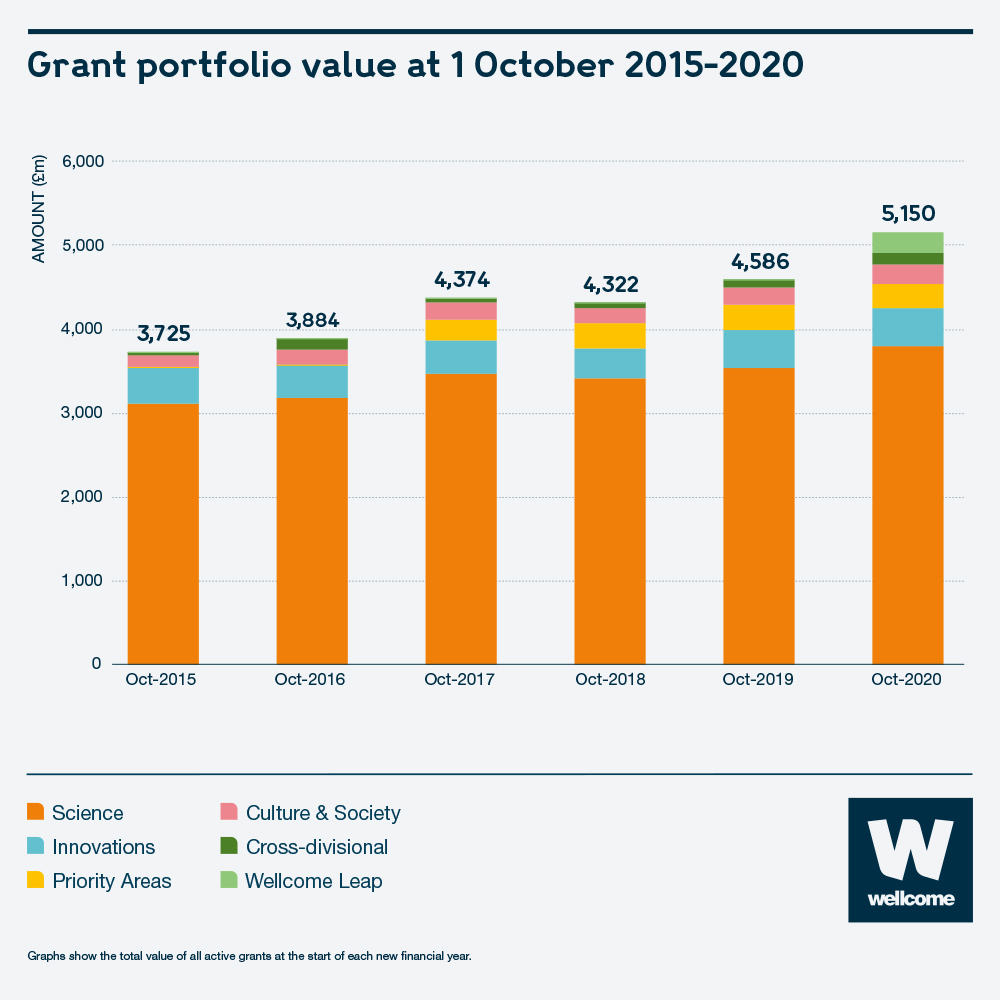
- Our grant portfolio has increased in total value by 38% to £5,150m since 2015/16.
- Our international grant portfolio has grown by 128% to £1,586m since 2015/16.
- 40% of the total funding committed over the past five years has been spent on our standard response funding mode schemes.
- Application numbers have decreased by 47% to 3,584 since 2018/2019 due to the closure of several funding schemes.
- Our funding is concentrated within a few organisations. 75% of our grant portfolio is held by 20 organisations, and 38% is held by the University of Oxford, the Sanger Institute, the University of Cambridge and University College London
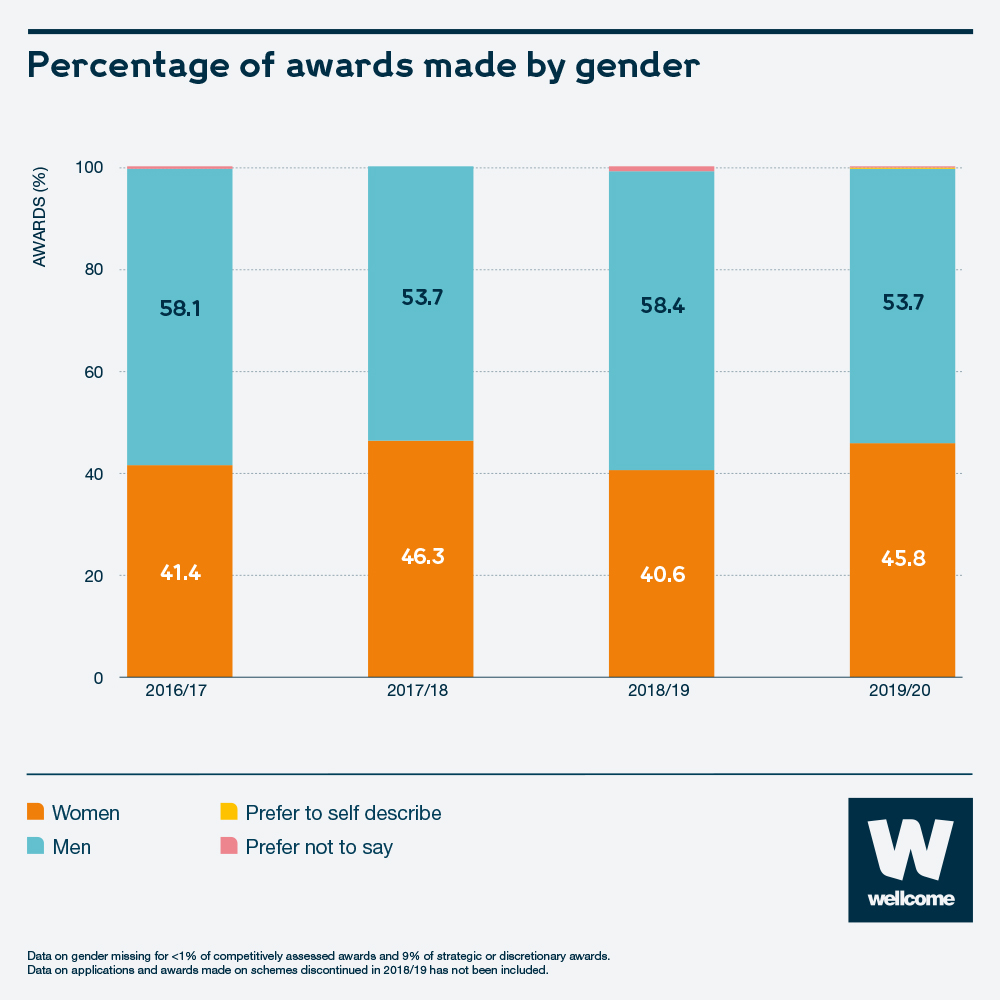
- Success rates over the past four years are similar by gender (13% for men, 12.7% for women) but differ by ethnicity (8% for UK-based Black, Asian and Minority Ethnic applicants, 14% for UK-based White applicants).


How we're putting diversity, equity and inclusion at the heart of our strategy
Wellcome Trust Annual Report and Financial Statements 2020
See our list of Wellcome grants awarded 1 October 2005 to 30 June 2021 [XLSX 10.83MB]
This spreadsheet has been created using the 360Giving data standard. The work is licensed under the Creative Commons Attribution 4.0 International Licence, which means the data is freely available to anyone to be used and shared as they wish. The data must be attributed to Wellcome.