Grant funding data 2019 to 2020
Listing summary
Grant funding data 2019 to 2020.
Priority areas
English
Standfirst
This report provides data on the grants we've funded over the past year and funding trends for the past five years.
It includes the number and value of awards in our current grant portfolio, application and award rates, and who we've funded and where.
Published date
Content
Admin title
Read report link
Group
Link
Link style
Primary
Content
Body
- Facts and figures on our grant funding and grant recipients for the period 1 October 2019 to 30 September 2020
- Funding trends over the past five years.
Body
- Anyone interested in what Wellcome spends on grant activities and who receives Wellcome funding
- Researchers and research office staff.
Styling options
Secondary
Group title
Key findings
Admin title
Key findings
Group
Body
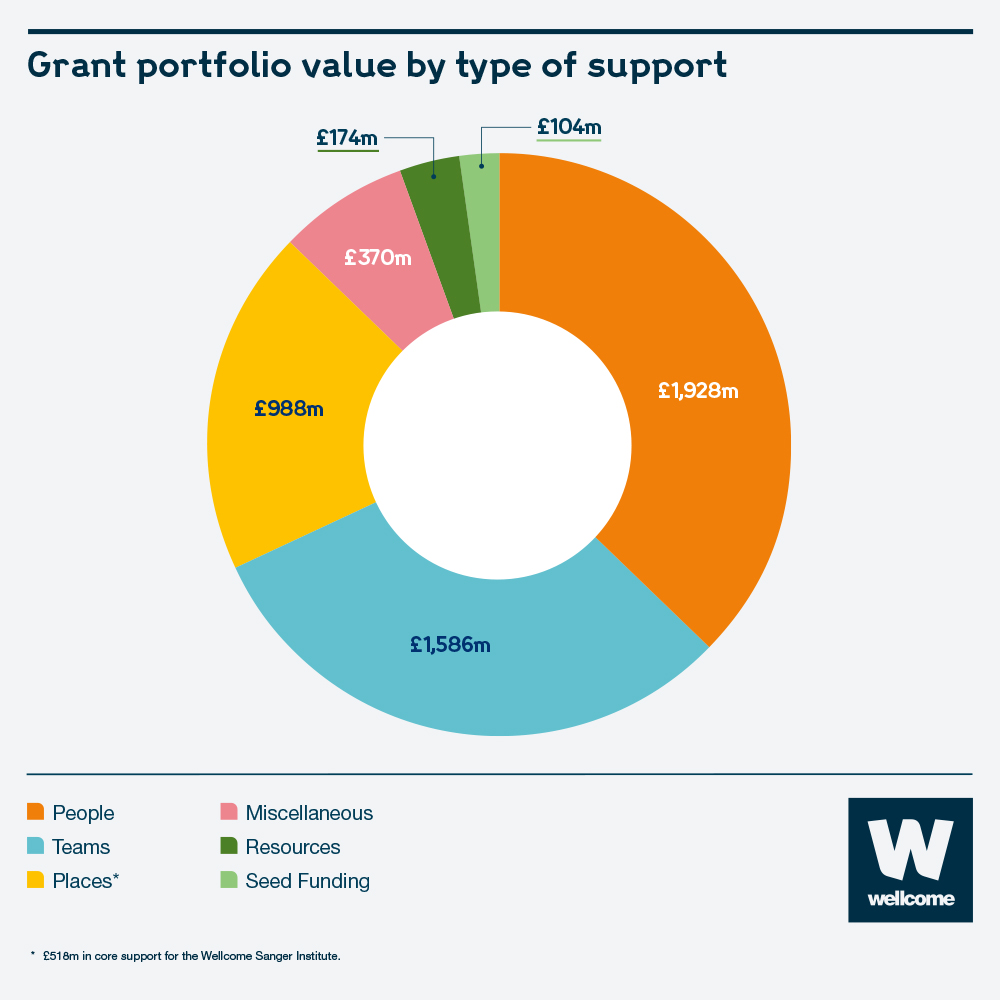
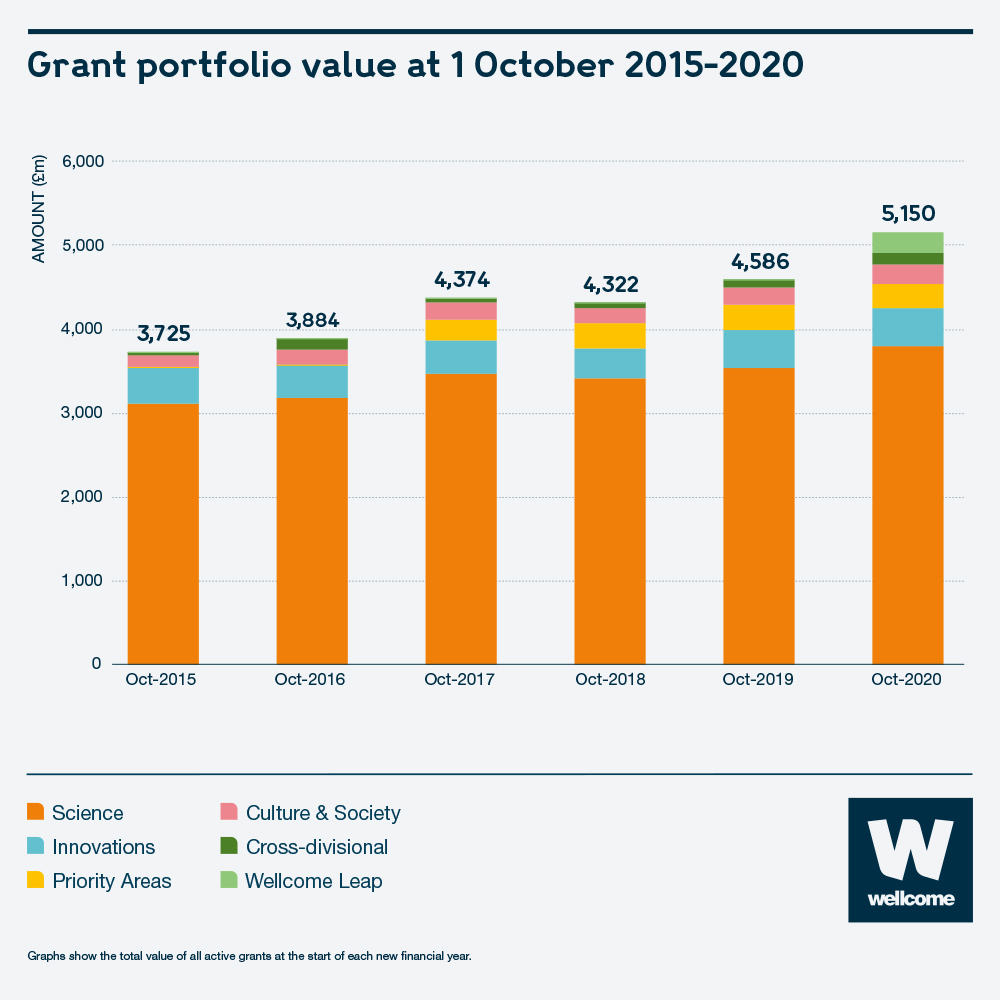
- Our grant portfolio has increased in total value by 38% to £5,150m since 2015/16.
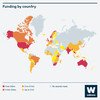
- Our international grant portfolio has grown by 128% to £1,586m since 2015/16.
- 40% of the total funding committed over the past five years has been spent on our standard response funding mode schemes.
- Application numbers have decreased by 47% to 3,584 since 2018/2019 due to the closure of several funding schemes.
- Our funding is concentrated within a few organisations. 75% of our grant portfolio is held by 20 organisations, and 38% is held by the University of Oxford, the Sanger Institute, the University of Cambridge and University College London
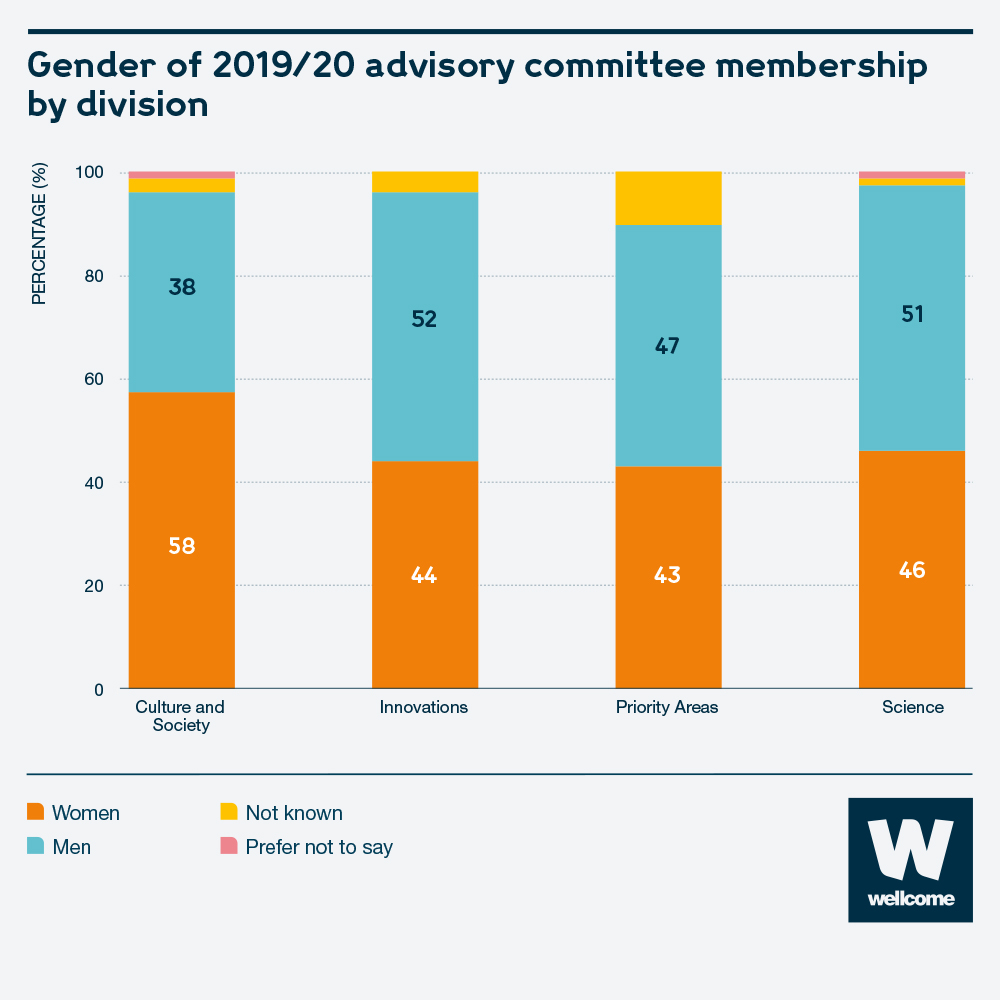
- Success rates over the past four years are similar by gender (13% for men, 12.7% for women) but differ by ethnicity (8% for UK-based Black, Asian and Minority Ethnic applicants, 14% for UK-based White applicants).
Group title
Infographics
Admin title
Infographics
Group
Gallery images
File size
290698 bytes
Image width
1000px
Image height
1000px
Filename
funding_by_country.jpg
Image

Download allowed
On
File size
181049 bytes
Image width
1000px
Image height
1000px
Filename
grant_portfolio_value_by_type_of_support.jpg
Image
Download allowed
On
File size
29544 bytes
Image width
601px
Image height
601px
Filename
grant-portfolio-value-by-area-of-activity.png
Image

Download allowed
On

File size
231820 bytes
Image width
1000px
Image height
1000px
Filename
grant_portfolio_value_at_1_october_2015-2020.jpg
Image
Download allowed
On
File size
196301 bytes
Image width
1000px
Image height
1000px
Filename
Gender_of_2019_20_advisory_committee_membership_by_division.jpg
Image
Download allowed
On
File size
202717 bytes
Image width
1000px
Image height
1000px
Filename
2019-2020_Percentage_of_awards_made_by_gender.jpg
Image

Download allowed
On
Admin title
Image gallery
Create hero image
Off
Infographics gallery
On
Group title
Downloads
Admin title
Downloads
Group
Listing layout
Link List
Content
Linked file
EmmaPalmer

File
File size
4259150 bytes
Mime type
application/pdf
Title
Wellcome grant funding data 2019-20
Listing text
This report provides data on the grants we've funded over the past year and funding trends for the past five years.
Priority areas
Topics
Type
Linked file
EmmaPalmer
File
wellcome-uk-grant-funding-table-2020.xlsx (37.14 KB)
File size
38035 bytes
Mime type
application/vnd.openxmlformats-officedocument.spreadsheetml.sheet
Title
Wellcome UK grant funding table 2020
Type
Admin title
Wellcome UK grant funding table 2020
Group title
Related content
Admin title
Related content
Published on
Display in page navigation
On
Exclude from listings
Off
Add noindex
Off