This is chapter 2 of the Wellcome Global Monitor 2018.
This is chapter 2 of the Wellcome Global Monitor 2018
Read all chapters
Summary
- Almost everywhere, men are notably more likely than women to claim that they know 'a lot' or have 'some' knowledge about science, indicating a 'gender gap' in self-assessed knowledge. This gap exists even though women are generally as likely as men to say they learned about science at different stages of education. This gender gap is largest in Northern Europe, standing at a 17-percentage-point difference. Other regions with a sizeable gender gap in perceived knowledge of science include South Asia (16 points), East Asia (15 points), Western Africa (14 points), Australia and New Zealand (13 points) and Eastern Africa (13 points).
- The Wellcome Global Monitor’s results show a strong relationship between self-assessed knowledge of science and educational attainment. In all regions, people with lower levels of educational attainment are less likely to say they understood 'all' or 'some' of the definition of 'science' and 'scientists' offered at the start of the survey. In addition, people are more likely to seek science information the more highly they rate their own knowledge of science.
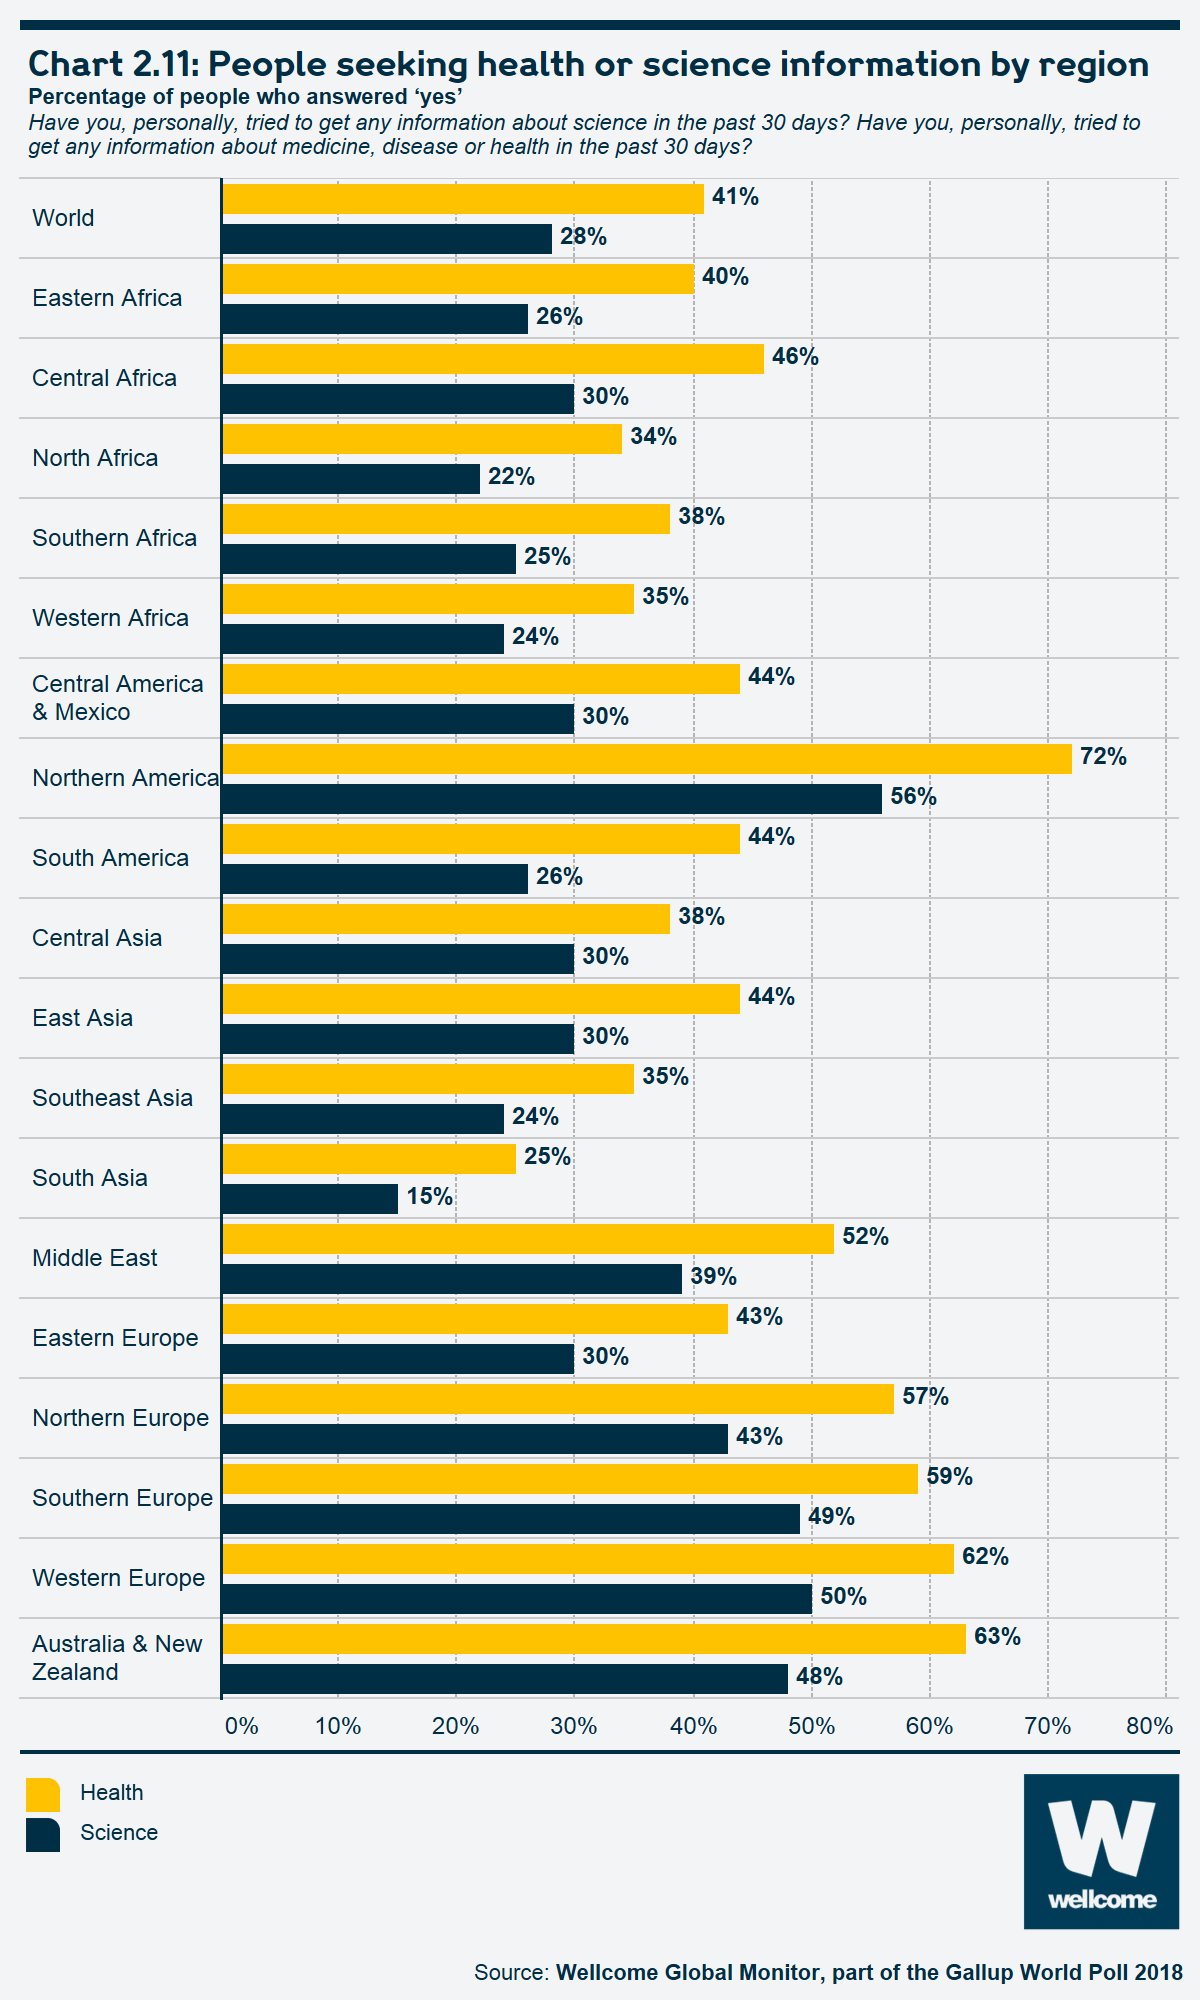
- Globally, 28% of people say they recently sought information about science. That figure rises to 41% of people who have recently sought information about medicine, disease or health.
- Almost two-thirds of people worldwide (62%) say they are interested in learning more about science. This is particularly the case among people living in low-income countries. In addition, 72% of people globally are interested in learning more about health, medicine and disease.
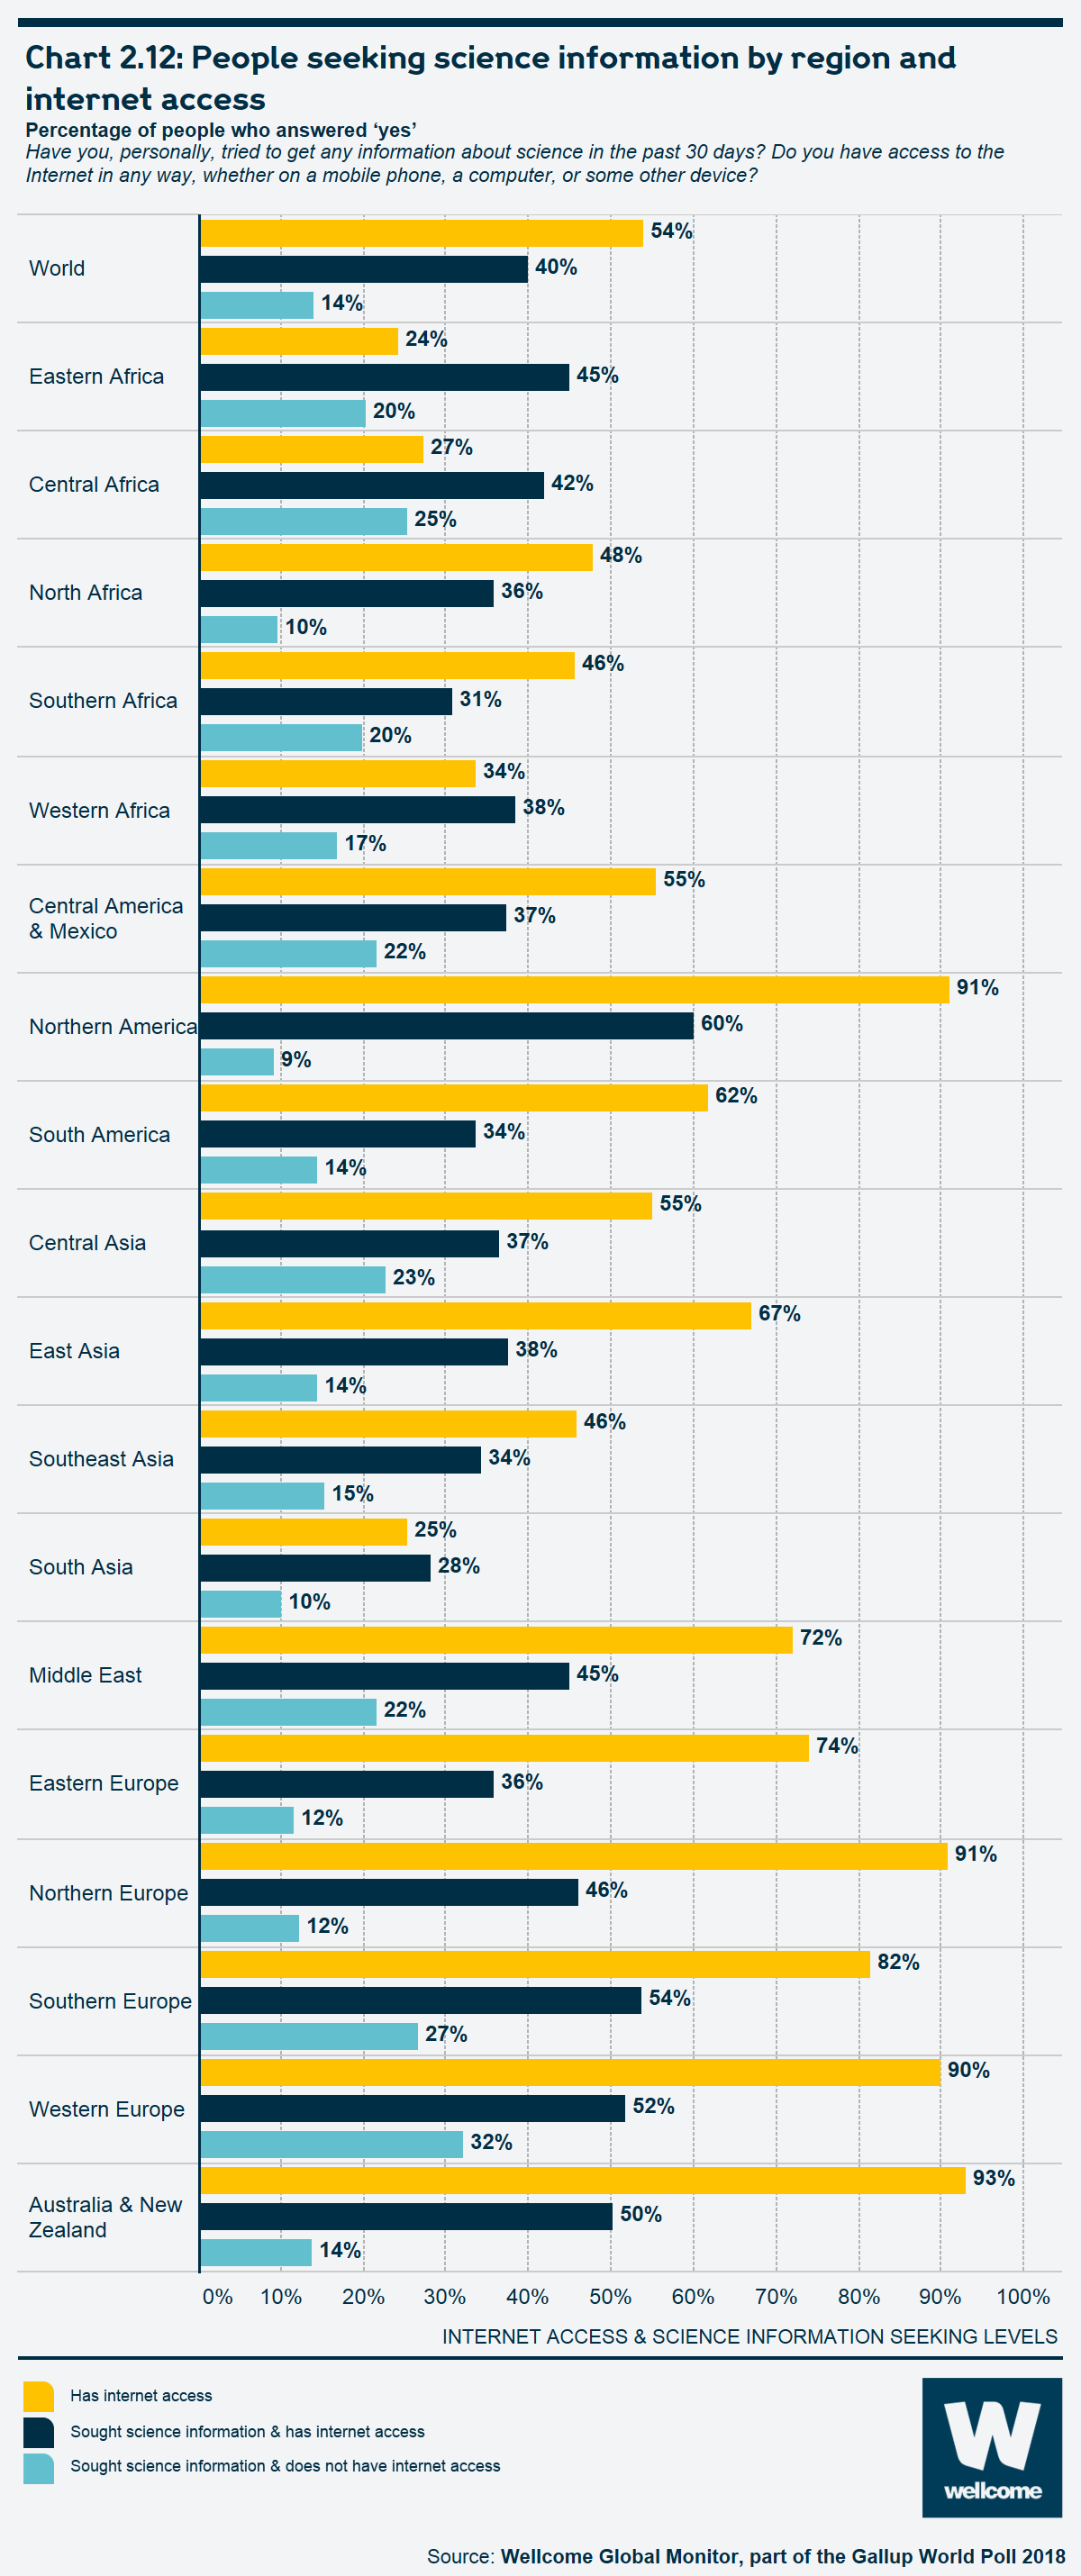
- In all regions, people who have internet access are far more likely than those who do not have internet access to have sought science or health information in the past 30 days.
- Although science is often said to be a 'universal' human language, the concepts of science and scientists are not commonly understood across all countries, even in high-income nations. This was as high as 32% in Central Africa, saying they understood none of the definition1 presented to them or 'don’t know', but as low as 2% in Northern America and most of Europe.
- Worldwide, more than half the people aged 15–29 (53%) say they know 'some' or 'a lot' about science, compared to 40% of those aged 30–49 and 34% of those aged 50 and older. This general pattern applies to nearly every region in the study, with younger people being more likely than their elders – especially those aged 50 and older – to say they know at least 'some' about science.
- Introduction
- The definition of 'science'
- Understanding of what studying science constitutes
- Perceived knowledge of science
- Science and health information seeking
- Interest in learning more about science and health
- Special focus: gender differences in perceived science knowledge and education
- Conclusion
Introduction
The Wellcome Global Monitor starts by asking people about the level of their self-assessed knowledge of science, then offers a standardised definition of the words 'science' and 'scientists' for people to think about throughout the survey. In conversations relating to science and health with people in different countries and cultures, it is important to know whether the concepts being discussed are understood in the same way across countries, and whether the terms are clear enough for people to participate in productive and engaging conversations.
Although there is no universally accepted definition of science, for the reasons discussed in Box 2.2, the Wellcome Global Monitor uses a definition that was adapted and simplified from definitions given by organisations such as the Science Council of Britain and various dictionaries. The definition was simplified and tested in seven countries (in local languages) and was shown to be largely effective during the testing phase of this study.2
The following statement and definition of 'science' and 'scientists' was used: On this survey, when I say 'science' I mean the understanding we have about the world from observation and testing. When I say 'scientists' I mean people who study the Planet Earth, nature and medicine, among other things.
After the definition was read, people were asked: How much did you understand the meaning of 'science' and 'scientists' that was just read? Did you understand all of it, some of it, not much of it or none of it?
- To what extent are the concepts of 'science' and 'scientists' understood differently in different countries and cultures, and across different demographic groups (such as gender and age)? Are there any differences in understanding what those terms mean, or are they equally understood globally?
- Is there a difference in the way people interact with science across countries and different demographic groups (such as gender, age, education, etc.)?
- To what extent do people seek information about science and about health (separately), and would they like to know more about science and about health-related matters?
Wellcome Global Monitor questions examined in this chapter:
- How much do you, personally, know about science? Do you know a lot, some, not much, or nothing at all?
- On this survey, when I say 'science' I mean the understanding we have about the world from observation and testing. When I say 'scientists' I mean people who study the Planet Earth, nature and medicine, among other things. How much did you understand the meaning of 'science' and 'scientists' that was just read? Did you understand all of it, some of it, not much of it, or none of it?
- Do you think studying diseases is a part of science?
- Have you, personally, ever learned about science at primary school, secondary school, college or university?
- Have you, personally, tried to get any information about science in the past 30 days?
- Have you, personally, tried to get any information about medicine, disease or health in the past 30 days?
- Would you, personally, like to know more about science?
- Would you, personally, like to know more about medicine, disease or health?
The definition of 'science'
The definition of 'science' is understood differently across countries and cultures
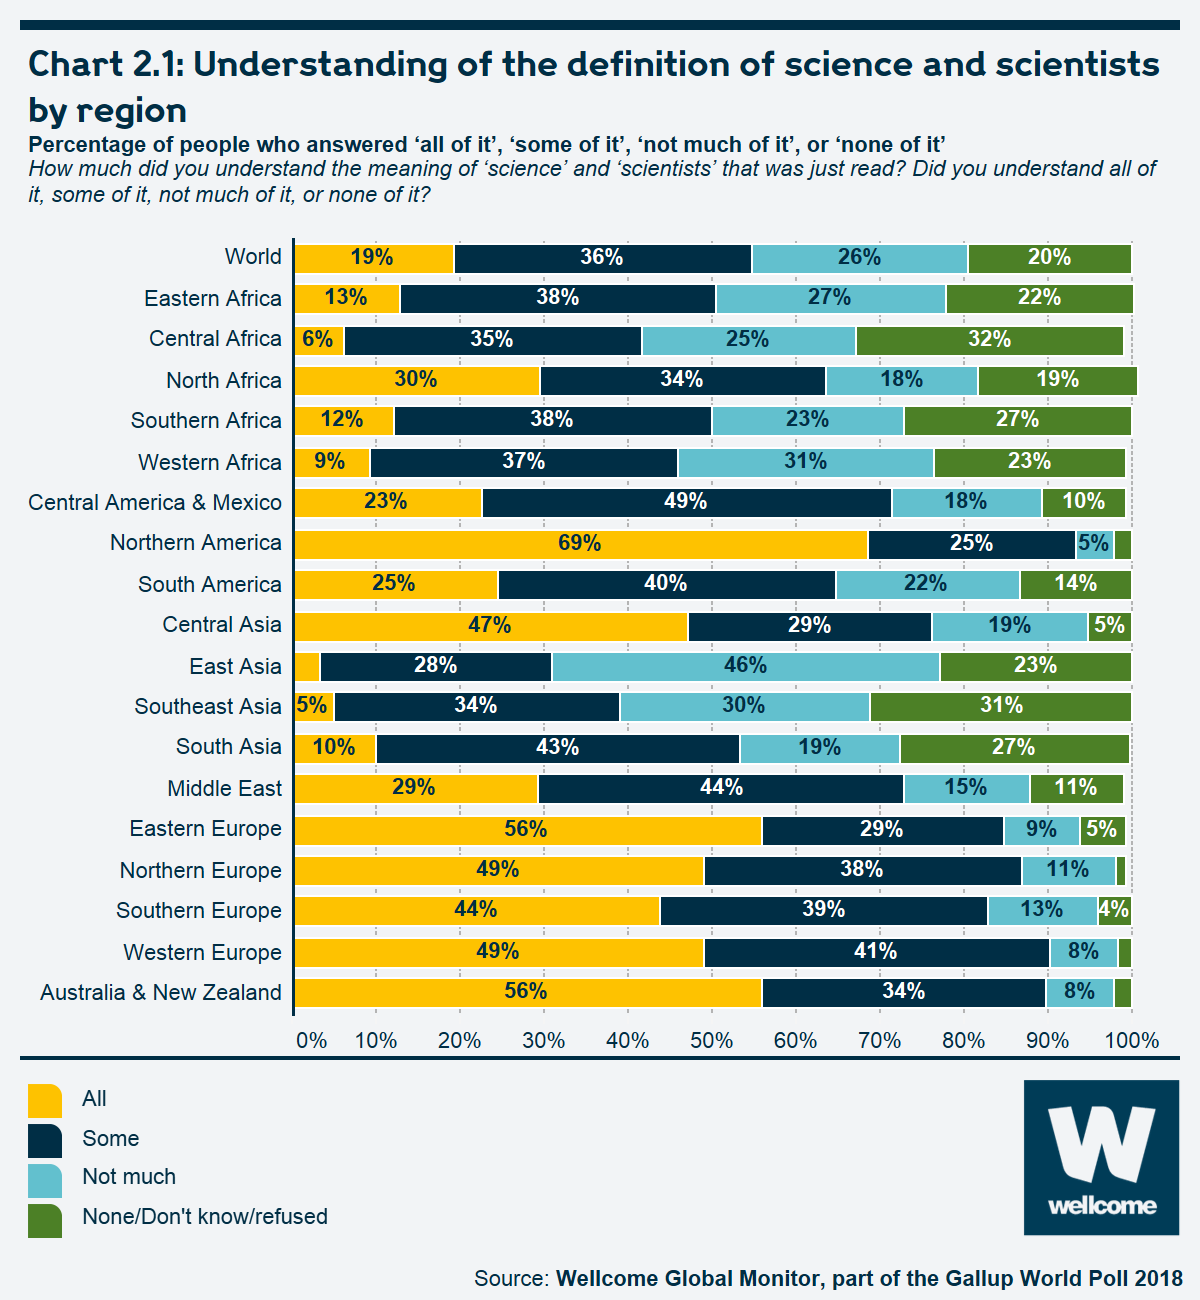
Globally, around 19% of people said they understood 'all' of the definition, and almost the same number of people said that they understood 'none' of it/did not know. Around one-third of people said they understood 'some' of the definition (36%), while 26% said they understood 'not much' of it.
As Chart 2.1 shows, the degree of understanding varied considerably by region, with a majority of people in Northern America, Australia and New Zealand and Eastern Europe saying they understood 'all' of the definition.
Central Africa and Southeast Asia registered the highest number of people who said they understood 'none' of the definition.
Chart 2.1: Understanding of the definition of science and scientists by region

See the interactive version of this chart.
Results from the Wellcome Global Monitor in-depth interview (cognitive) testing suggests that, in general, including a definition would improve the reliability of cross-country comparisons. Yet, even with a definition included, a sizeable minority of people still found the concepts of 'science' and 'scientists' challenging to understand.
There seems to be no universally accepted definition of science – even within the scientific community itself. In the 1960s, science philosophers Karl Popper and Thomas Kuhn put forth very different views of what constitutes scientific progress, both of which have been influential in shaping ideas about how science is distinguished from other knowledge systems. Even as recently as 2009, one professional organisation, the Science Council of Britain, announced its own new definition for the word 'science', after a year of work and research.3
Some define science as a process of study and discovery – this was the essence of the Science Council of Britain’s new definition for the word4 – while others would define it as a body of knowledge about the world. Given that the precise definition of science is still debated among scientists themselves, we might expect varying levels of understanding of those terms among people in most countries. In nearly 100 cognitive interviews conducted in eight countries over the questionnaire development phase of this study, most – but not all – people provided a shared understanding of science driven by evidence, logic and research.5
However, in some languages (for example in some of the Arabic-speaking countries), the words used for 'science' and 'scientists' were sometimes interpreted differently to the meaning of the word in English. For instance, in some Muslim-majority countries, the word ‘scientists’ was sometimes understood to mean religious scholars. In addition, some people associated science with a type of knowledge that is beyond their grasp. In India, for example, some felt that only the wealthy educated people could understand or be connected to science or scientists. In other countries (for example in Russia), people were surprised and puzzled why humanities subjects (such as anthropology, philosophy, etc.) were not included in the definition of 'science'.
Those (and other) findings from the survey testing stage led us to decide to include a definition of science so that cross-country results could be interpreted more reliably. Nevertheless, even with the inclusion of a definition, a significant minority of people (some 20% globally) still found the concepts of 'science' and 'scientists' challenging.
While further in-depth research is needed to understand those regional and country differences, initial research indicates that in countries where science is given more prominence in the economy – measured by how much money is spent on science and technology research, as estimated by gross domestic expenditures on research and development (GERD)6 statistics – tend also to have a greater percentage of people saying they understood ‘some’ or ‘all’ of the definition.7
Cultural differences are also likely to be a factor. Other research has found that a country’s social and cultural environment is an important factor in shaping how people feel about science and the extent of their interest and engagement with it.8 Regions such as East Asia and South Asia both express relatively low familiarity with the definition, despite the important role that science appears to play in countries such as China, Japan or India, as indicated by such measures as GERD.9 This suggests that people in those regions do not necessarily understand science in the same terms as described in the definition.
Thus, while the definition helps anchor the specific concepts in people’s minds and renders cross-country comparisons more reliable, it also demonstrates the possible shortcomings of a definition that does not take into account local culturally relevant factors.10
In all regions, people with lower levels of educational attainment were less likely to say they understood 'all' or 'some' of the definition
A person’s level of education is associated with how well they understood the given definition of science: in all regions, people with lower levels of educational attainment were less likely to say they understood 'all' or 'some' of the definition.
Table 2.1: Understanding of the definition of science and scientists by education and region
Percentage of people who answered 'all of it', 'some of it', 'not much of it', or 'none of it'.
How much did you understand the meaning of 'science' and 'scientists' that was just read? Did you understand all of it, some of it, not much of it, or none of it?
| Region | Primary education | Secondary Education | Tertiary Education |
|---|---|---|---|
| World | 22% | 57% | 71% |
| Eastern Africa | 29% | 65% | 77% |
| Central Africa | 42% | 63% | 77% |
| North Africa | 21% | 60% | 86% |
| Southern Africa | 12% | 38% | 87% |
| Western Africa | 24% | 48% | 61% |
| Central America and Mexico | 23% | 49% | 72% |
| Northern America | N/A* | 73% | 70% |
| South America | 17% | 46% | 92% |
| Central Asia | 40% | 54% | 63% |
| East Asia | 16% | 33% | 80% |
| Southeast Asia | 18% | 51% | 46% |
| South Asia | 26% | 68% | 73% |
| Middle East | 34% | 61% | 90% |
| Eastern Europe | 37% | 58% | 79% |
| Northern Europe | 53% | 64% | 80% |
| Southern Europe | 33% | 57% | 79% |
| Western Europe | 56% | 66% | 77% |
| Australia/New Zealand | 27% | 60% | 82% |
*Sample size too small
Understanding of what studying science constitutes
In all regions, a large majority agree that 'studying disease is a part of science'
To understand further how people think of science, the Wellcome Global Monitor also asked people if they think studying disease is a part of science. This question was asked as an alternative route to assess a person’s understanding of science. If people said they did not understand the definition given, it may have been on account of the definition being somewhat technical – for example, the words 'observation' and 'testing' may be confusing for people with low educational attainment levels. Therefore, we wanted to ask a question that was uncontroversial and universally understood. If people answered this question correctly, then it would indicate that they understood what science could do (studying disease), even if they did not understand the definition given.
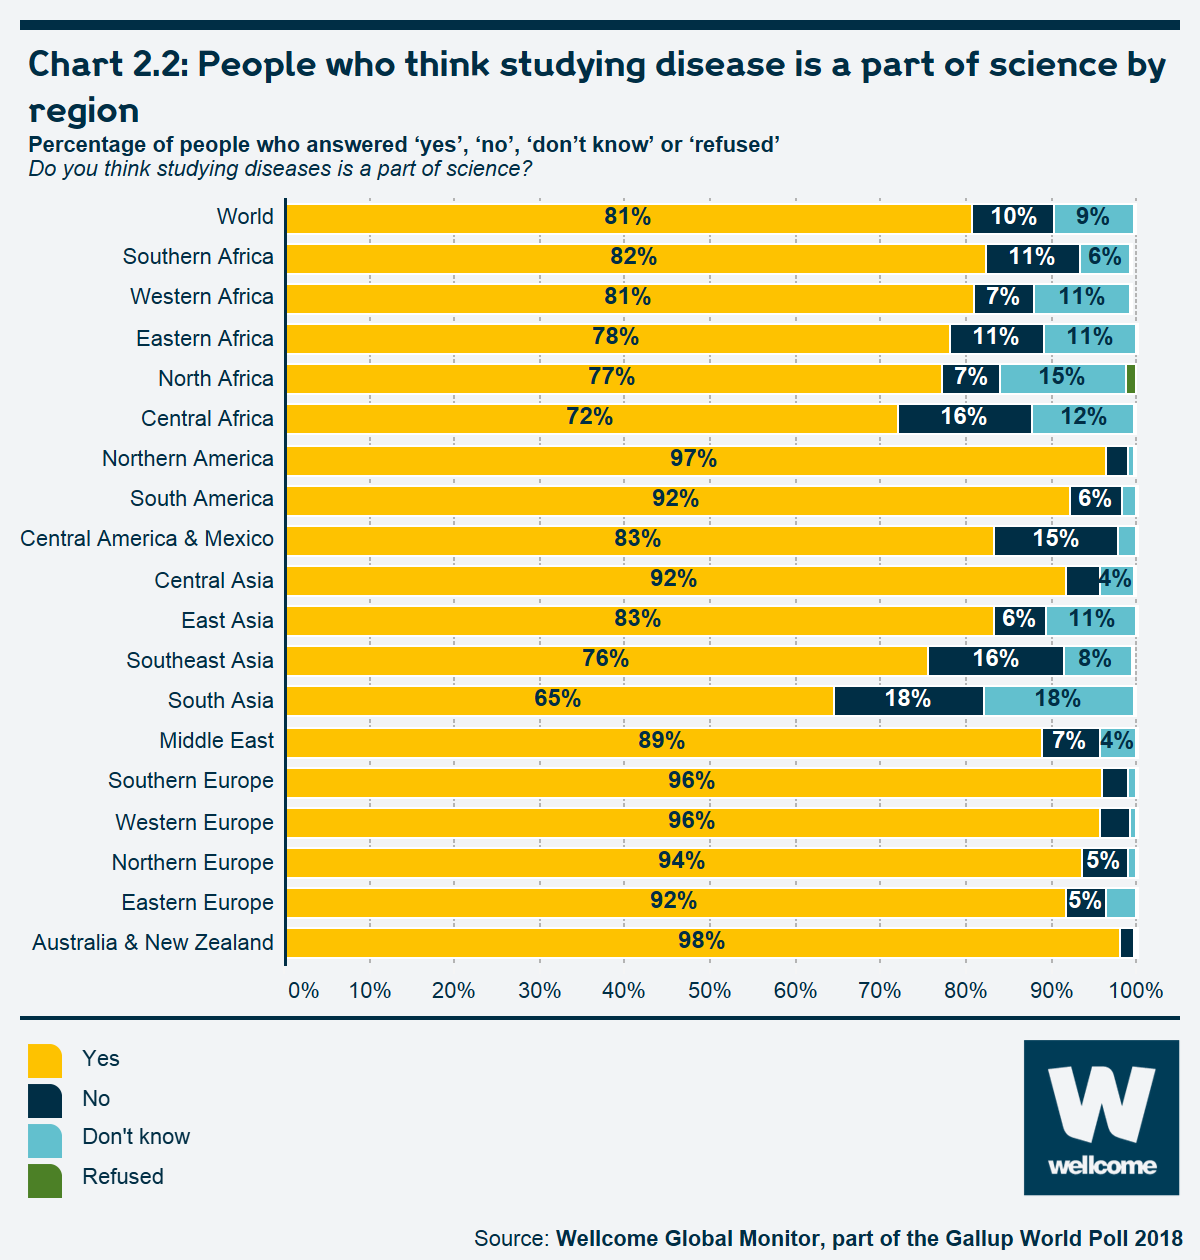
The results show that, at the global level, the clear majority – 81% – agree that it is. This demonstrates that many of those who were unfamiliar with the definition offered in the survey nonetheless associated ‘science’ with efforts to understand disease, thereby exhibiting an understanding of some of the practical aspects and applications of science, rather than a seemingly more 'theoretical notion' (being 'the understanding we have about the world from observation and testing'). Even among those who say they do not understand the definition of science at all, a majority – 56% – agree that studying disease is part of science.
Chart 2.2: People who think studying disease is a part of science by region

See the interactive version of this chart.
Regionally, South Asians are the least likely to say studying disease is part of science, at 65%. In Afghanistan and India, 70% and 63% of people respectively say that studying disease is a part of science. The figure is even lower in Pakistan, where only 52% say that studying disease is a part of science, fewer than any other country in the study. While there are likely to be a number of reasons for these results, one potential factor is the relative popularity of alternative medicine in Pakistan.11 This research is seemingly supported by the Wellcome Global Monitor finding that about one in four people in Pakistan trust traditional healers 'a lot'12 – one of the highest rates among the countries in the study. Of those who say they trust traditional healers 'a lot', only 43% say studying disease is a part of science, compared to 56% who say they trust traditional healers 'some', 'not much', or 'not at all'.
Perceived knowledge of science
Globally, around four in ten people say they know 'a lot' or have 'some' knowledge about science
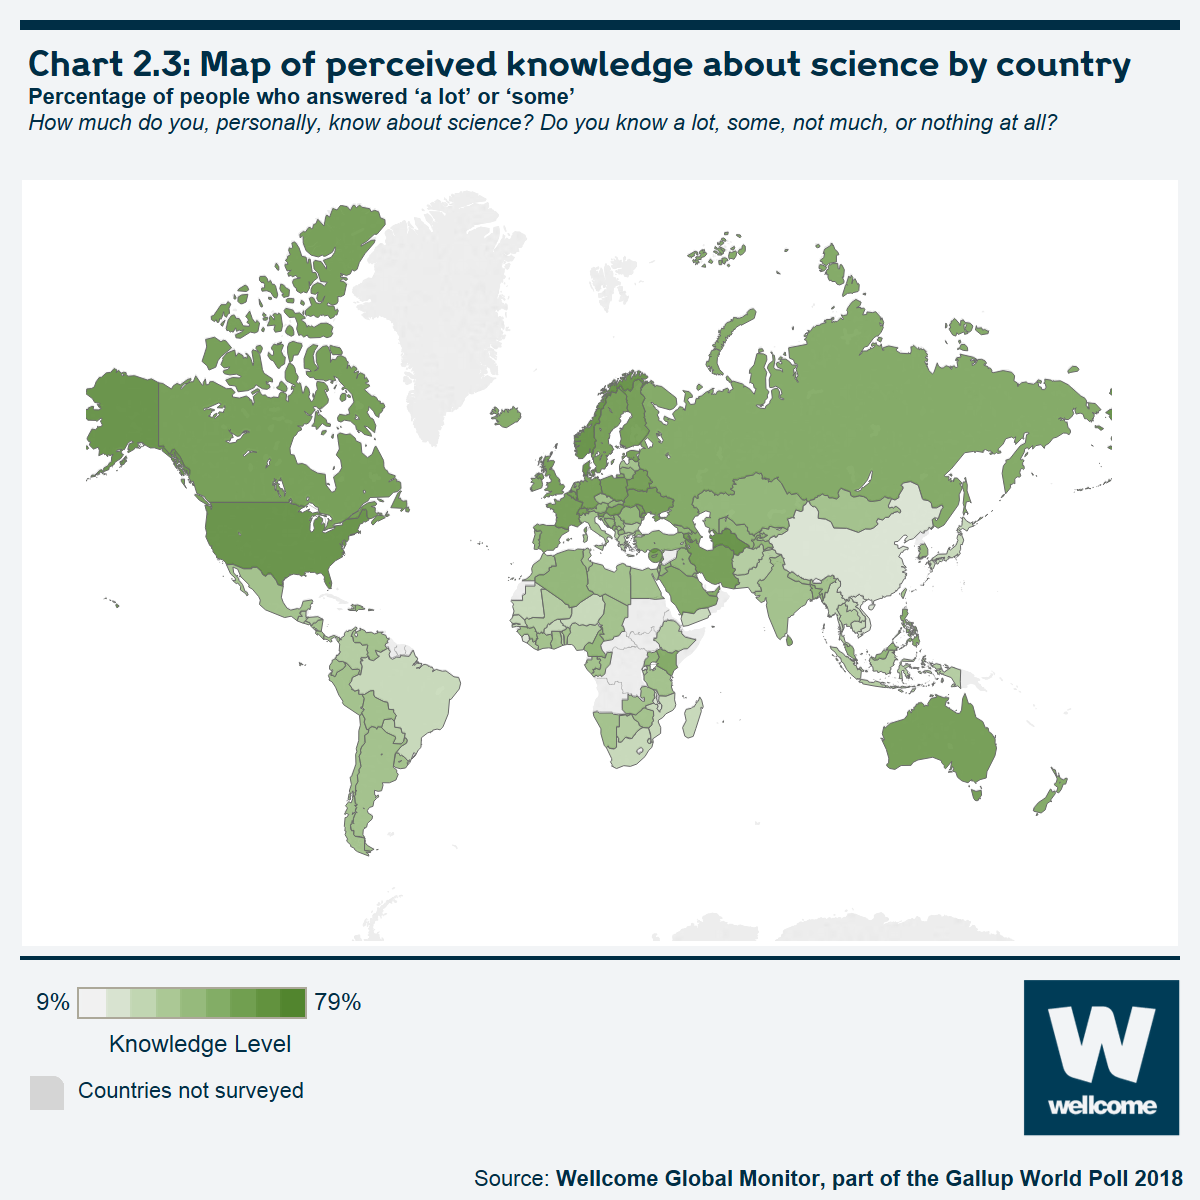
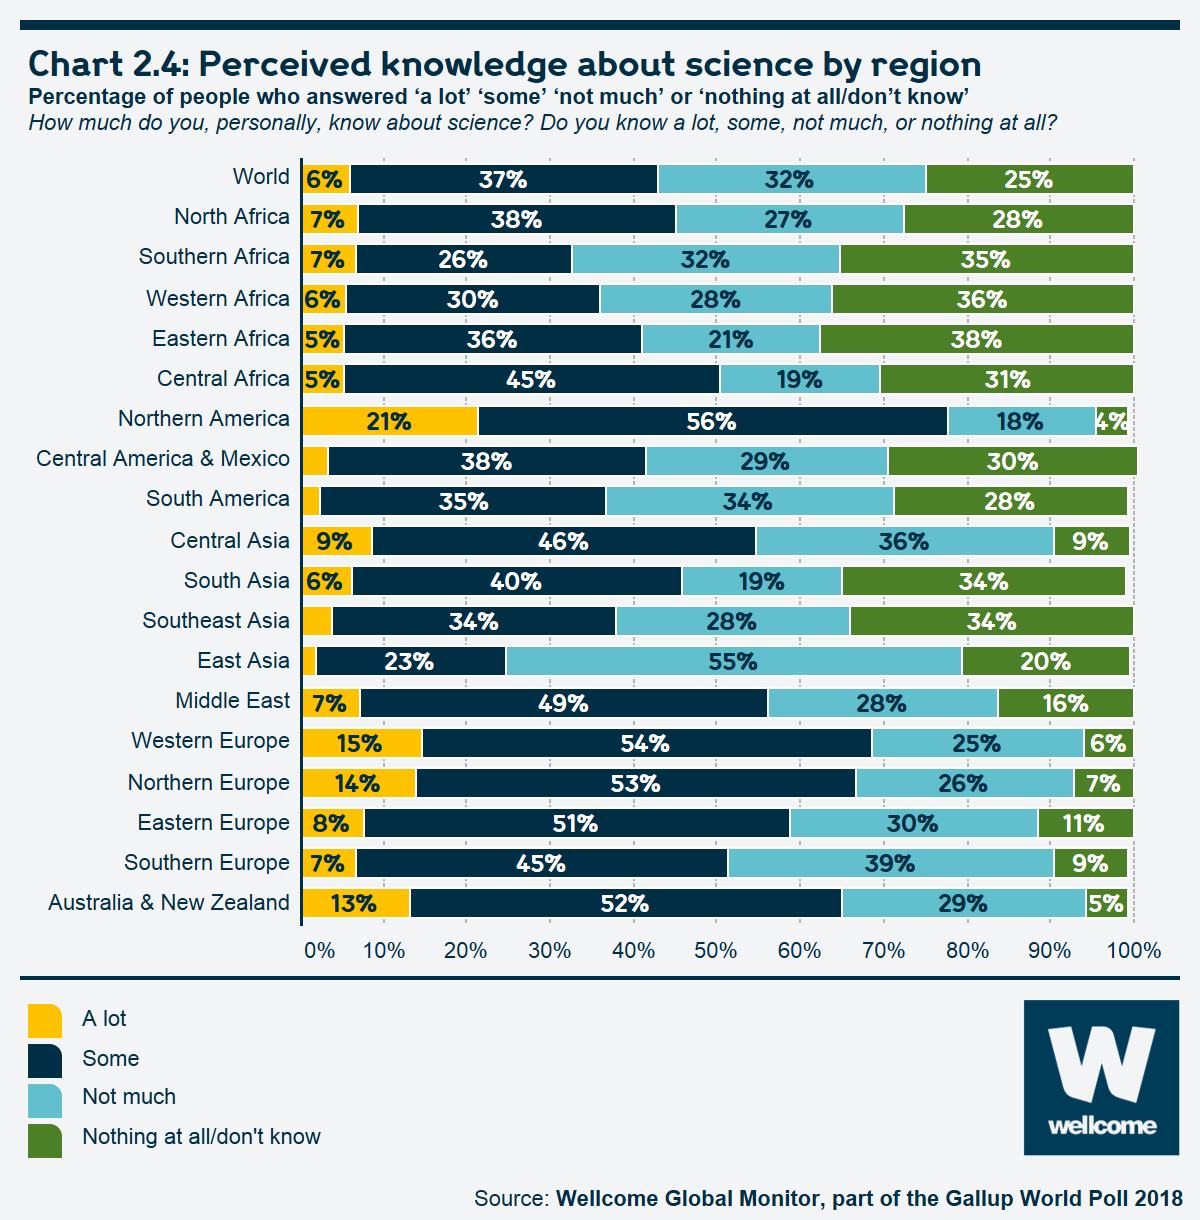
When asked to describe how much they personally know about science, slightly over four in ten people (43%) said they knew 'a lot' or had 'some' knowledge about science (37% said they had 'some' knowledge and 6% said they knew 'a lot' about science). Another 32% said they knew 'not much' about science, while a quarter said they knew 'nothing at all' or said they did not know. These results vary widely by country, with people in high-income countries tending to rate their knowledge more highly than people in lower-income countries (see Chart 2.3).
The Wellcome Global Monitor asked people to rate their own knowledge of science, asking 'How much do you, personally, know about science? Do you know a lot, some, not much or nothing at all?'
This type of question, which relies on people’s perceptions, is measuring subjective knowledge. However, many surveys examining public attitudes towards science have attempted to measure an individual’s level of knowledge about science objectively, typically through a series of quiz-like questions about scientific facts.13
During the testing phase of the Wellcome Global Monitor,14 the first draft of the questionnaire tested included a series of fact-based scientific questions. It quickly became apparent that such questions were not very well suited to a global study of this scale, where a majority of people did not seem to understand the scientific terms in local languages, and equally importantly, people were uncomfortable – and sometimes even irritated – by being asked 'test-like' questions.
Instead, we asked people to rate their own knowledge of science. While also imperfect as a measure, self-assessed knowledge is relevant as people sometimes behave or form opinions on the basis of what they think they know, rather than what they actually know, and the two are sometimes correlated fairly well. Past research has found that measures of such 'subjective knowledge' reflect a person’s confidence or comfort with the subject, which can be important in shaping other attitudes.15
Nine countries included in the study were especially confident in their knowledge of science, with over seven-in-ten people saying they knew 'some' or 'a lot' about science. These countries include: the US (79%), Turkmenistan (78%), Norway (77%), Denmark (75%), Armenia (71%), Canada (71%), France (71%), Germany (71%) and Luxembourg (71%). Meanwhile, at the other end of the confidence spectrum, there were two countries where less than a fifth of the population said they knew ‘some’ or ‘a lot’ about science, including Sierra Leone (17%) and Rwanda (9%).
Chart 2.3: Map of perceived knowledge about science by country
See the interactive version of this chart.
Regionally, people in Northern America are most likely to say they know 'some' or 'a lot' about science at 77%, followed by those in Northern Europe (67%), Australia and New Zealand (65%) and Western Europe (59%). People in East Asia (25%), Southern Africa (33%), and Western Africa (36%) are least likely to claim this level of scientific knowledge.
Chart 2.4: Perceived knowledge about science by region

See the interactive version of this chart.
Perceived self-assessed scientific knowledge also varies according to a country’s income level – though the primary difference is between high-income countries and all the other groups. Slightly more than six in ten people who live in a country designated by the World Bank as high income say they know 'some' or 'a lot' about science (62%), compared to 39% of those living in other countries.
Young people rate their science knowledge more highly in nearly all regions
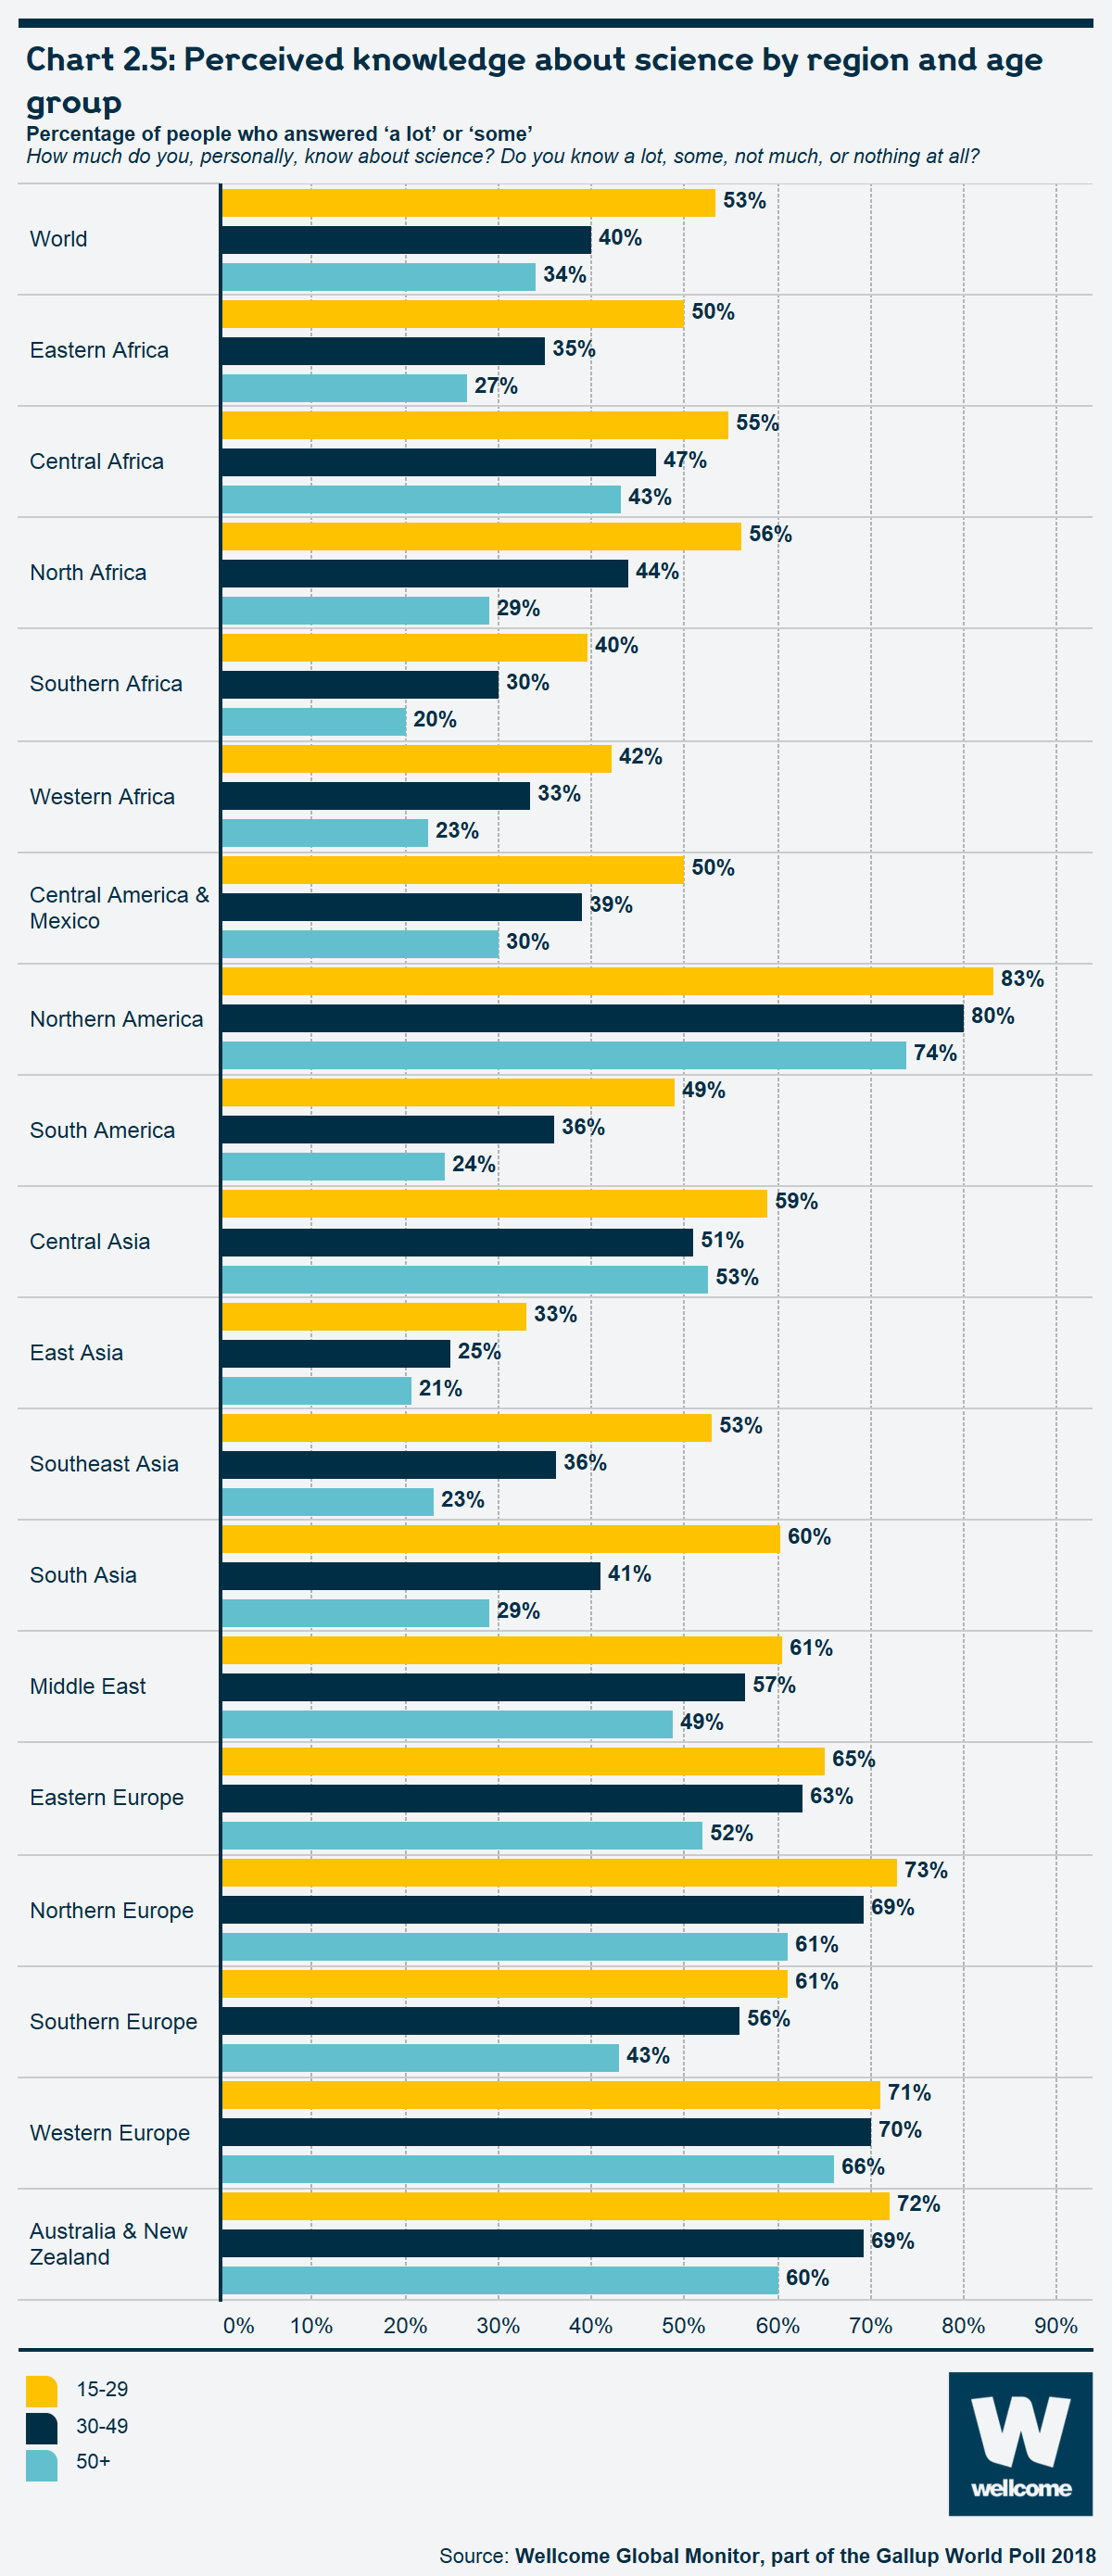
Worldwide, 53% of people aged 15–29 say they know 'some' or 'a lot' about science, compared to 40% of those aged 30–49 and 34% of those aged 50 and older. This general pattern applies to nearly every region in the study, with younger people being more likely than their elders – especially those aged 50 and older – to say they have at least 'some' knowledge about science.
Chart 2.5: Perceived knowledge about science by region and age group
See the interactive version of this chart.
Most people aged 15–29 rate their knowledge of science positively (having 'some' or 'a lot' of knowledge) in 12 of the 18 regions, including lower-income areas like North Africa or Central Africa (56% and 55%, respectively).
One possible reason for this age-related gap in how different age groups rate their knowledge of science is the fact that young people tend to be more educated than those who are older; they are also more likely to have learned science while at school. Globally, 69% of people aged 15–29 have completed at least secondary education, compared to 55% of those aged 30–49 and 40% of people aged 50 or older. Over nine in ten young people (93%) said they learned science while at school, compared to a slightly lower 88% for those aged 30–49 and 80% for people aged 50 or older.
Among those people who did learn science at school, younger people may have greater confidence in their level of scientific knowledge as it is a more recent experience. This could be one of the reasons why young people are more likely to say they know 'some' or 'a lot' about science compared to older people who also learned about science at school: 58% of people aged 15–29 said they had at least 'some' knowledge about science, compared to 49% of those aged 30–49 and 47% of those aged 50 or older.
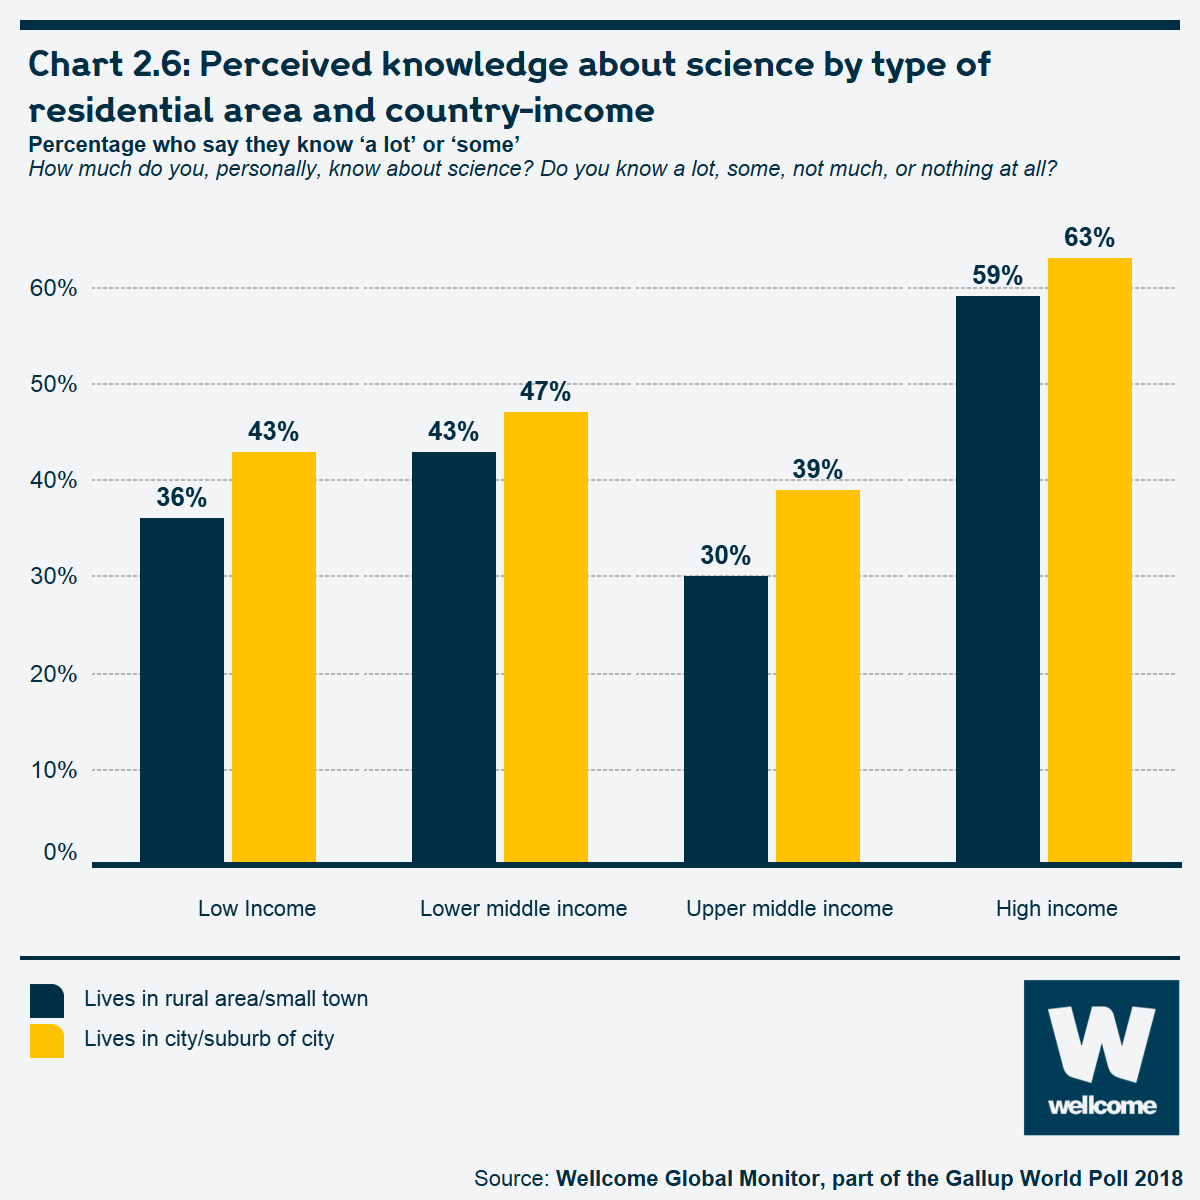
Perceived self-assessed knowledge also differs if a person lives in or around an urban area or not, with those in such areas more likely than others to say they know 'a lot' or 'some' about science (see Chart 2.6). Generally speaking, some research suggests that educational provision and its quality may be more variable in rural areas.16
Chart 2.6: Perceived knowledge about science by type of residential area and country-income
See the interactive version of this chart.
People with more education report higher levels of science knowledge
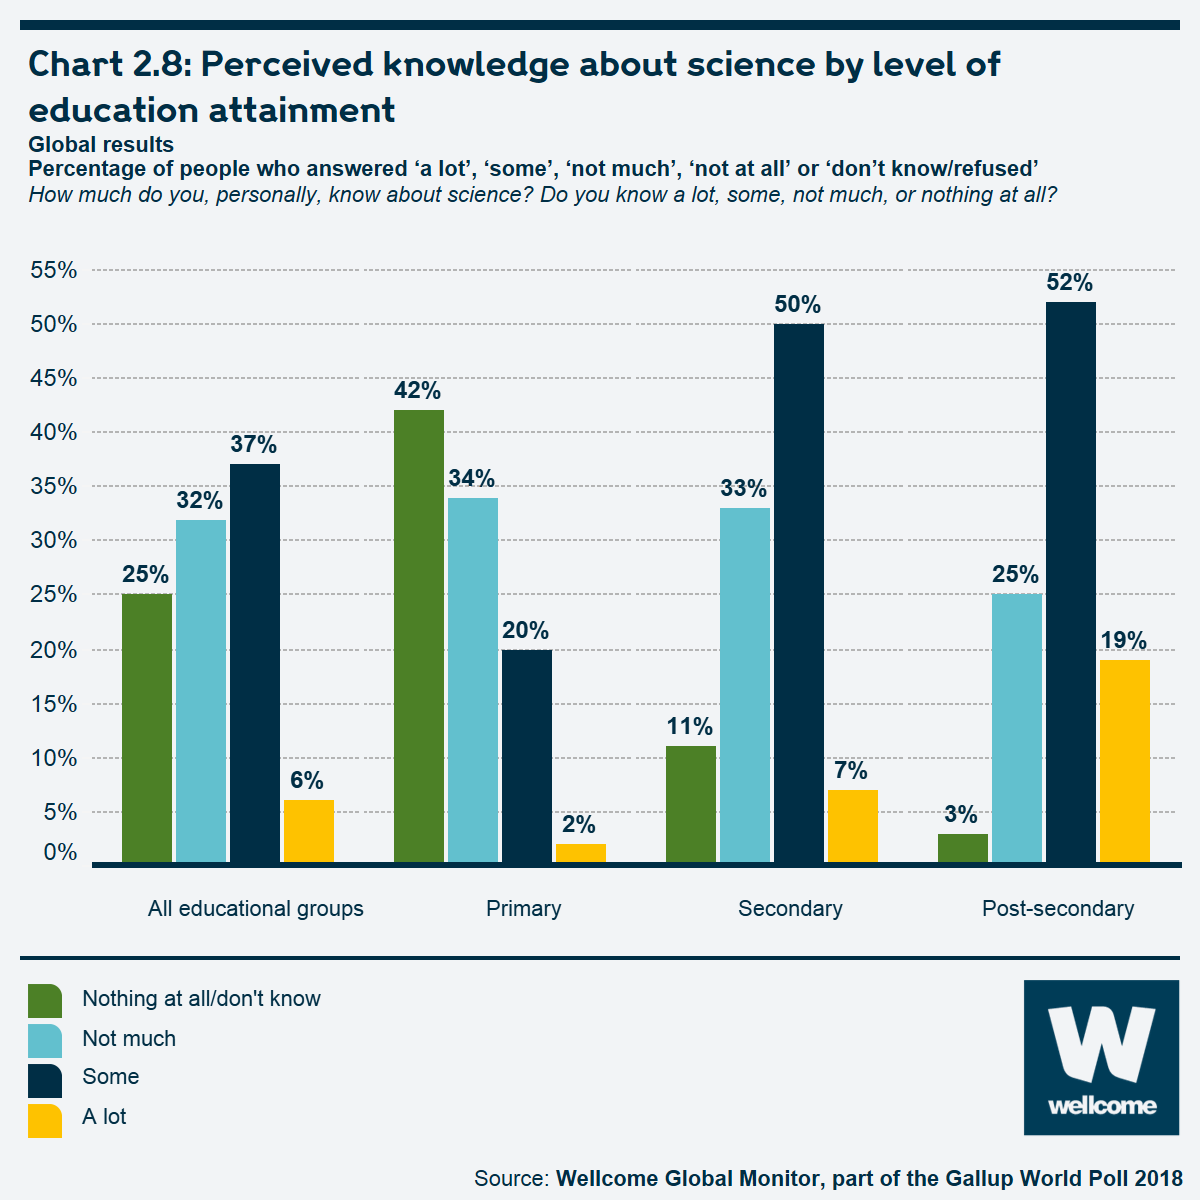
Though prior research has shown that self-assessed knowledge is not always a reliable indicator of actual knowledge,17,18 the Wellcome Global Monitor’s results show a strong relationship between this item and educational attainment, as well as with an indicator of perceived quality of education systems.
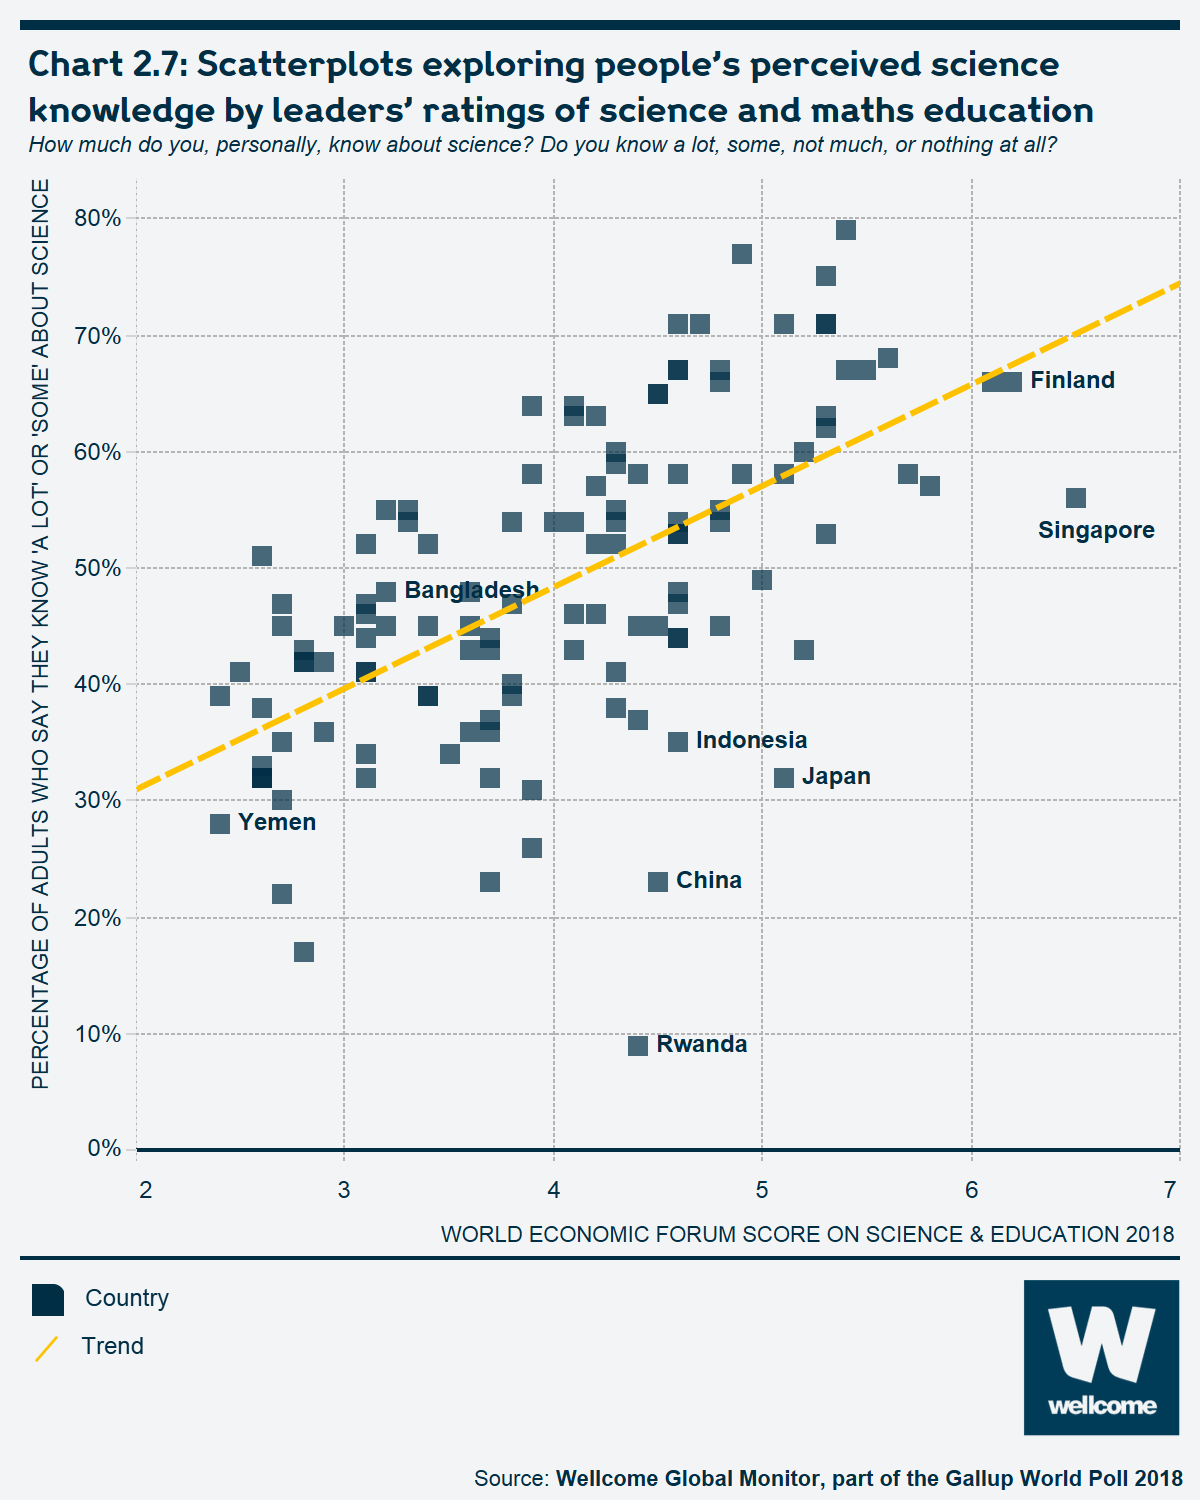
For example, the World Economic Forum (WEF) Global Competitiveness Index,19 asks executives across industries and countries: 'In your country, how would you rate the quality of math and science education?' on a 1–7 scale, where 1 means 'extremely poor' and 7 means 'excellent'. In Chart 2.7, scores for 124 countries are plotted against the percentage of people in each country who say they know 'some' or 'a lot' about science.
Chart 2.7: Scatterplots exploring people’s perceived science knowledge by leaders’ ratings of science and maths education

See the interactive version of this chart.
The two measures appear to be positively related, with a correlation of around 0.60 at the country level. Among countries with higher WEF scores on science and maths education, people are more likely to say they know 'some' or 'a lot' about science. In cases where the two indicators diverge, the results invite further exploration of how factors specific to a given country or region influence people’s perceptions of their own knowledge. The data from East and Southeast Asia may offer further evidence that supports the research20,21 that finds that a cultural emphasis on modesty makes people less likely to claim a high level of science knowledge even in countries where WEF ratings suggest maths and science education is relatively strong.
The relatively low number of Rwandans who claim at least some science knowledge relative to the country’s current WEF education score (see Chart 2.7 above) may in part reflect the government’s concerted efforts over the last decade to expand access to education for all.22 UNICEF reports that Rwanda had, as of 2016, achieved the Millennium Development Goal of universal primary education, and the 2018 Gallup World Poll found that, of the 35 countries surveyed, Rwanda boasts the highest proportion of people who are satisfied with the schools in their area, at 81%.
The Wellcome Global Monitor finds that self-assessed science knowledge is higher among the youngest Rwandans, those most likely to have benefited from the country’s recent education expansion, though young people worldwide tend to rate their knowledge of science more positively than older individuals (see Chart 2.5). Rwandans aged 15 to 24 are more likely than those aged 25 and older to say they know 'some' or 'a lot' about science – 14% compared to 7%, respectively. The gap is more striking with regard to those who say they know 'nothing at all' about science – 26% of Rwandans aged 15 to 24 respond this way, compared to 45% of those aged 25 and older.
Moreover, personal educational attainment is strongly linked to how people assess their own knowledge of science. Among people worldwide with eight or fewer years of formal education, fewer than one in four (22%) say they know 'some' or 'a lot' about science. That figure rises sharply to 57% among those with 9 to 15 years of education and 71% among those with 16 years of education or more. Notably, even in the highest education group – those with a college-level education – only about one in five (19%) feel they know 'a lot' about science.
Chart 2.8: Perceived knowledge about science by level of education attainment
See the interactive version of this chart.
Lower-income countries lag in educational exposure to science
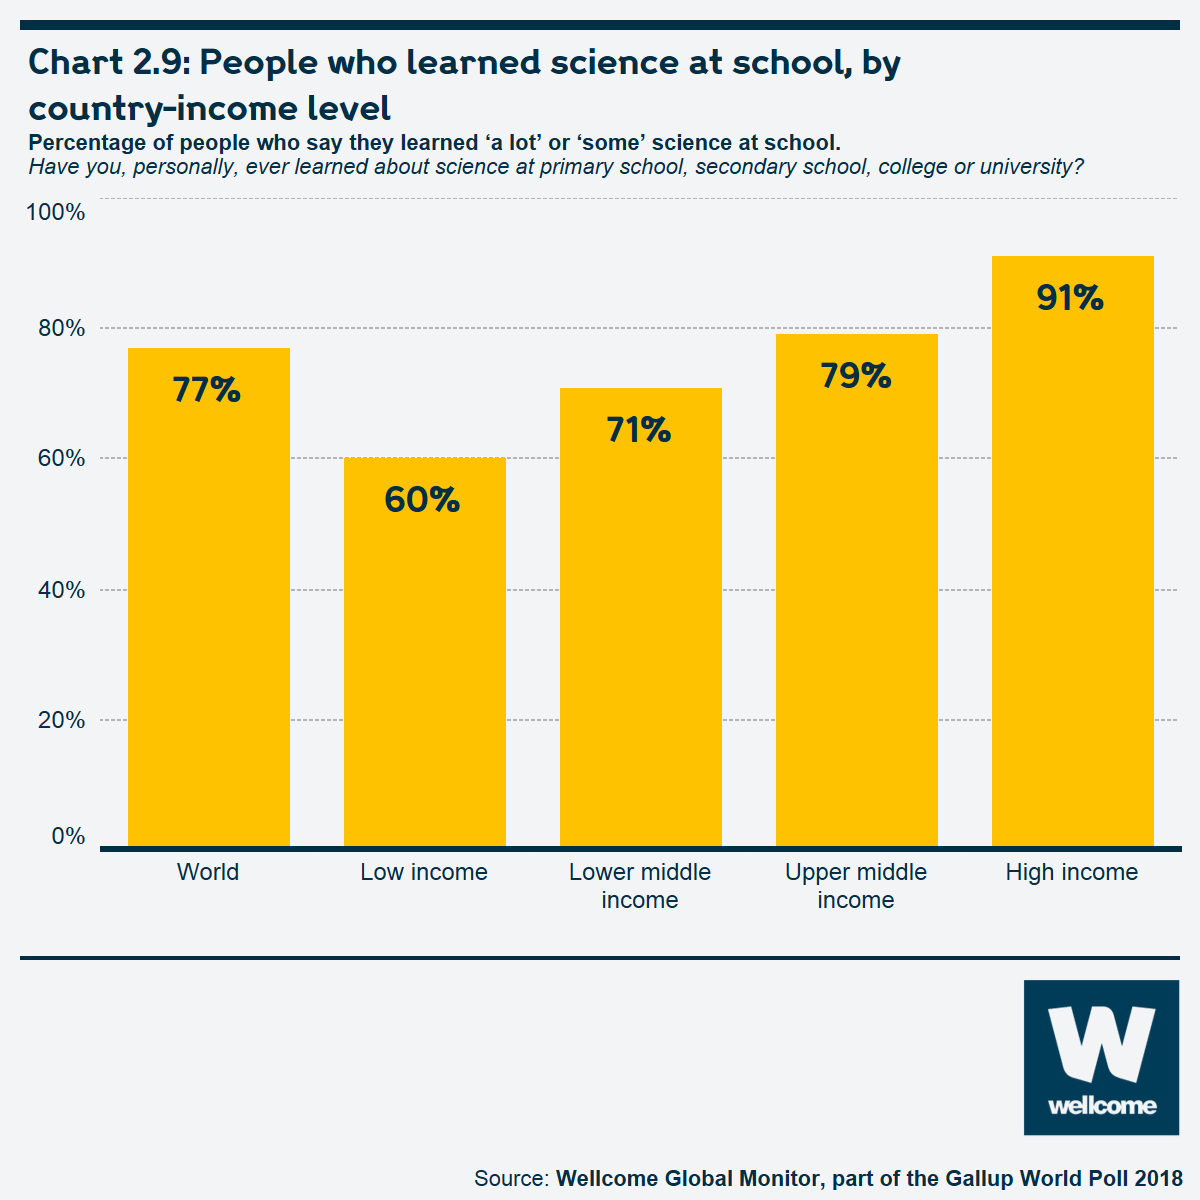
Slightly fewer than 8 in 10 people (77%) worldwide say they learned about science in school. People in low-income countries generally have lower rates of educational attainment; even so, six in ten said they learned science at school. That figure rises steadily among higher-income country groups, from 71% in lower-middle-income countries to 79% in upper-middle-income countries, to 91% in the high-income country group.
Chart 2.9: People who learned science at school, by country-income level
See the interactive version of this chart.
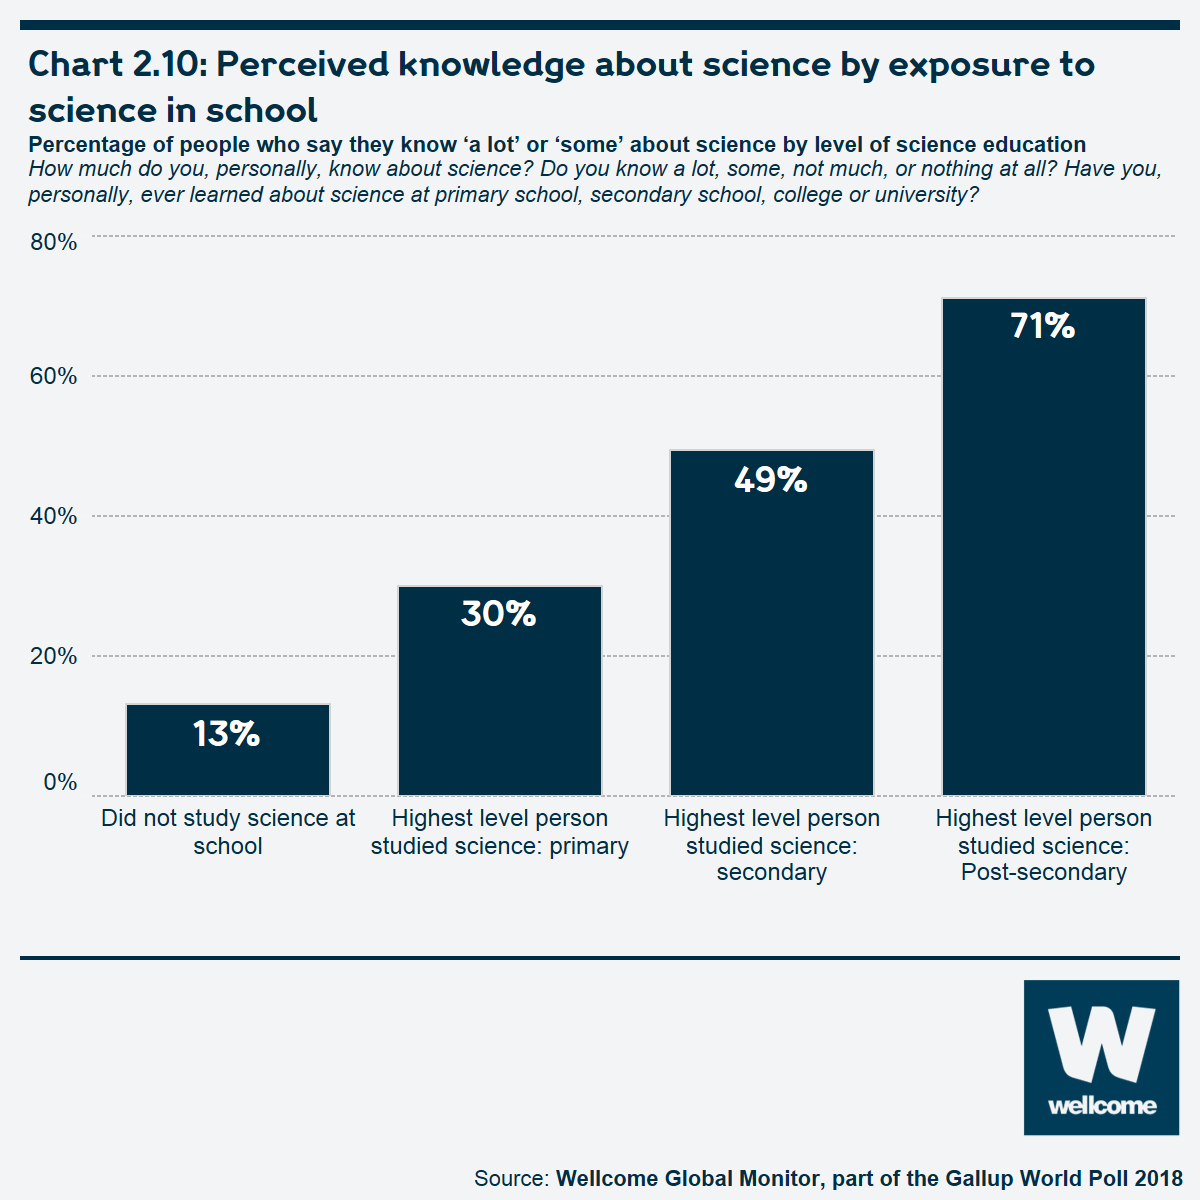
People’s assessments of their own science knowledge are also strongly related to the extent to which they have studied science at school. Among those who either did not study science at school or were not sure, fewer than one in five worldwide (13%) said they knew 'a lot' or 'some' science. Among those who learned science at the primary school level only, 30% said they knew 'some' or 'a lot' about science; for those who learned science at the secondary level and no higher, 49% said they knew 'some' or 'a lot' about science. Nearly three-quarters of people who learned science at the college or university-level (71%) said they knew at least 'some' about science.
Chart 2.10: Perceived knowledge about science by exposure to science in school
See the interactive version of this chart.
Chart 2.11: People seeking health or science information by region

See the interactive version of this chart.
The finding that people are likely to seek health information more than science information is consistent with past research on the topic.23
People are more likely to seek science information the more highly they rate their own knowledge of science
The likelihood that an individual has sought science information is strongly related to their self-assessed knowledge of science, as well as the extent to which they studied science in school. Two-thirds (67%) of those who indicated they knew 'a lot' about science say they had recently sought information about a science-related topic, as had 56% of those who said they learned science during their college or university years.
People with internet access are more likely to have recently sought science or health information
Access to the internet appears to be an important factor enabling a person to seek information on science and health. As part of the Gallup World Poll, people are asked if they personally have access to the internet; as Chart 2.12 shows, people in all regions who have internet access are far more likely than those who do not have access to the internet to have sought science information in the past 30 days.
Chart 2.12: People seeking science information by region and internet access
See the interactive version of this chart.
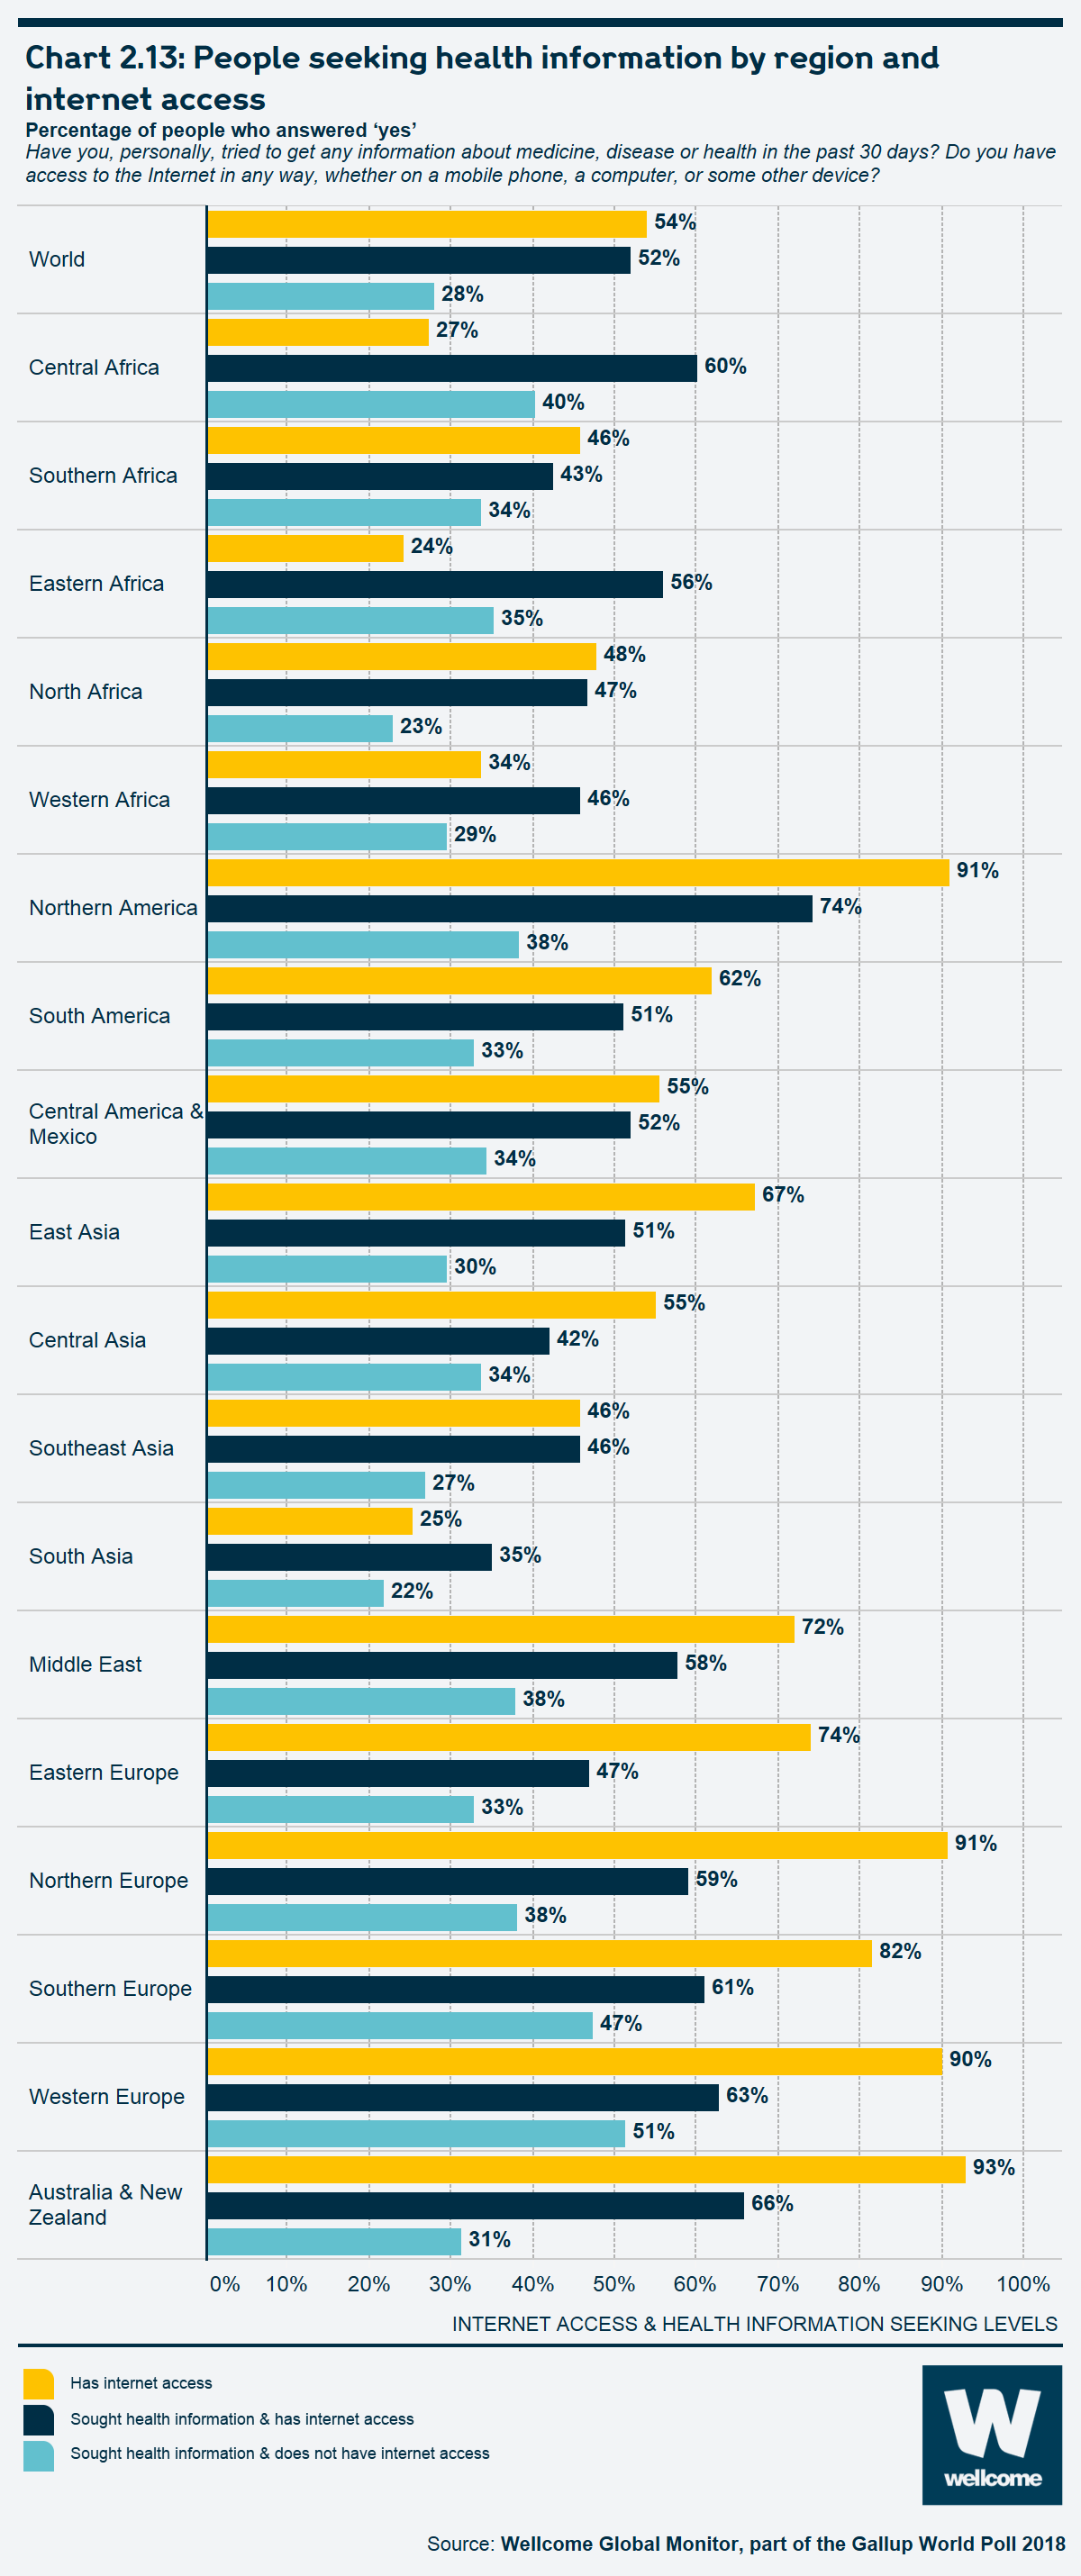
There is a similar internet access gap when looking at the corresponding question on information about medicine, disease or health. Worldwide, 52% of people with access to the internet say they have tried to get such information in the past 30 days, compared to 28% of those without internet access.
Chart 2.13: People seeking health information by region and internet access
See the interactive version of this chart.
Interest in learning more about science and health
Worldwide, most people express interest in learning more about science and health, especially in lower-income regions
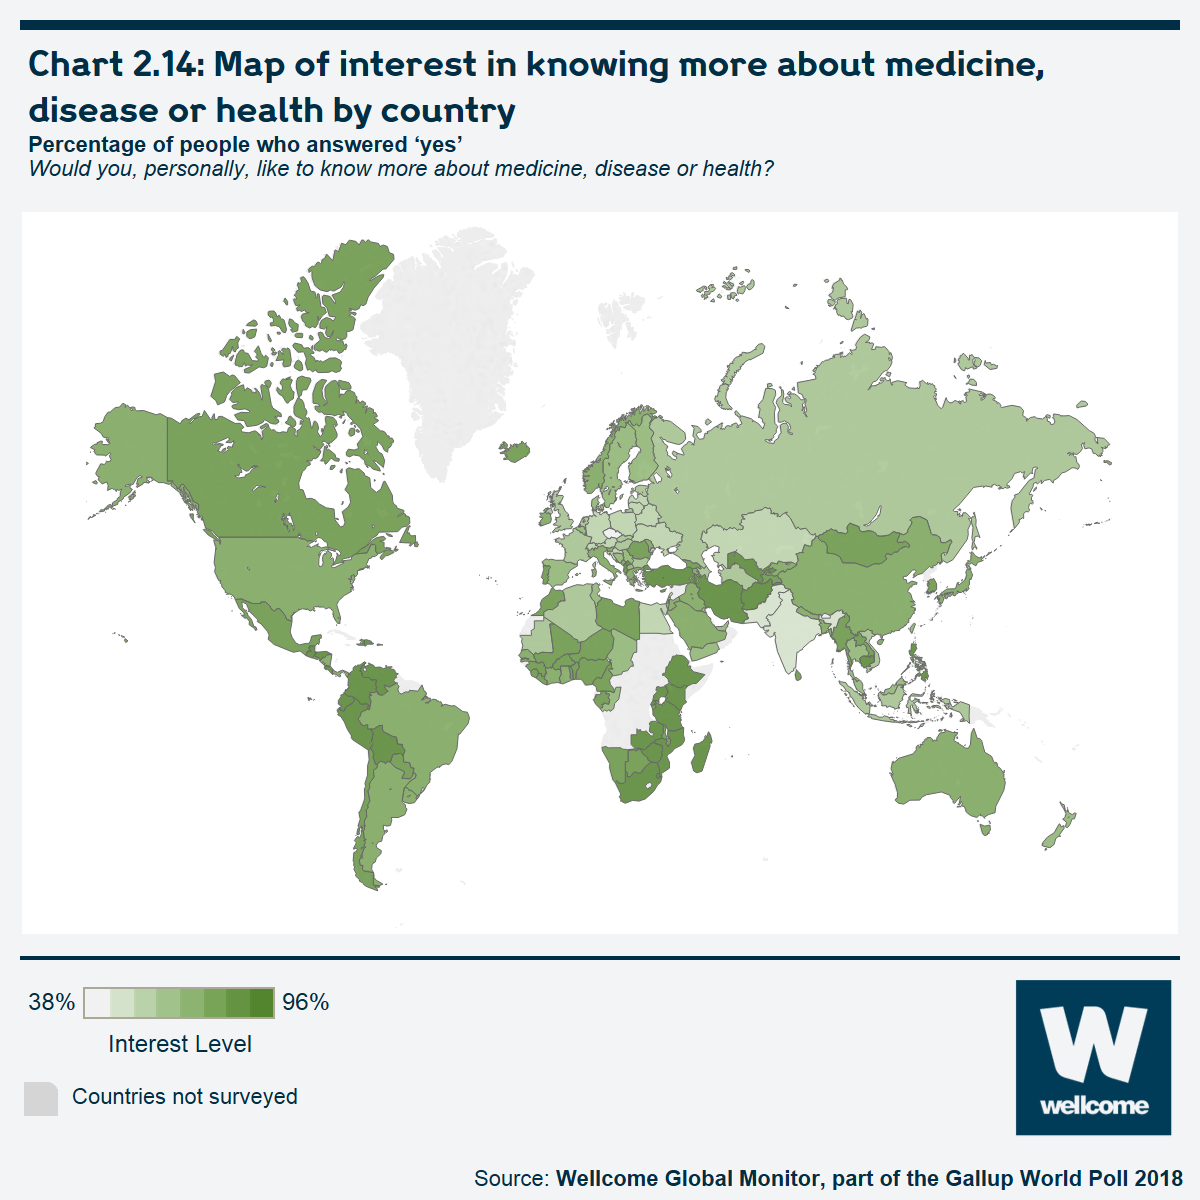
The Wellcome Global Monitor also asks people whether they are interested in learning more about science and health; these items depend less on the overall ease with which people can access information (through the internet or otherwise). At the global level, 62% of people say they are interested in learning more about science, while 72% are interested in learning more about health. Chart 2.14 presents country-level results for interest in health, which ranges from a high of 96% in Uganda and The Gambia to a low of 38% in the Czech Republic. While further research is needed to understand exactly why so many people are interested in learning more about health, some research24,25 suggests that this is related to information that is directly personally relevant for either preventative or curative purposes relating to health and disease.
Chart 2.14: Map of interest in knowing more about medicine, disease or health by country
See the interactive version of this chart.
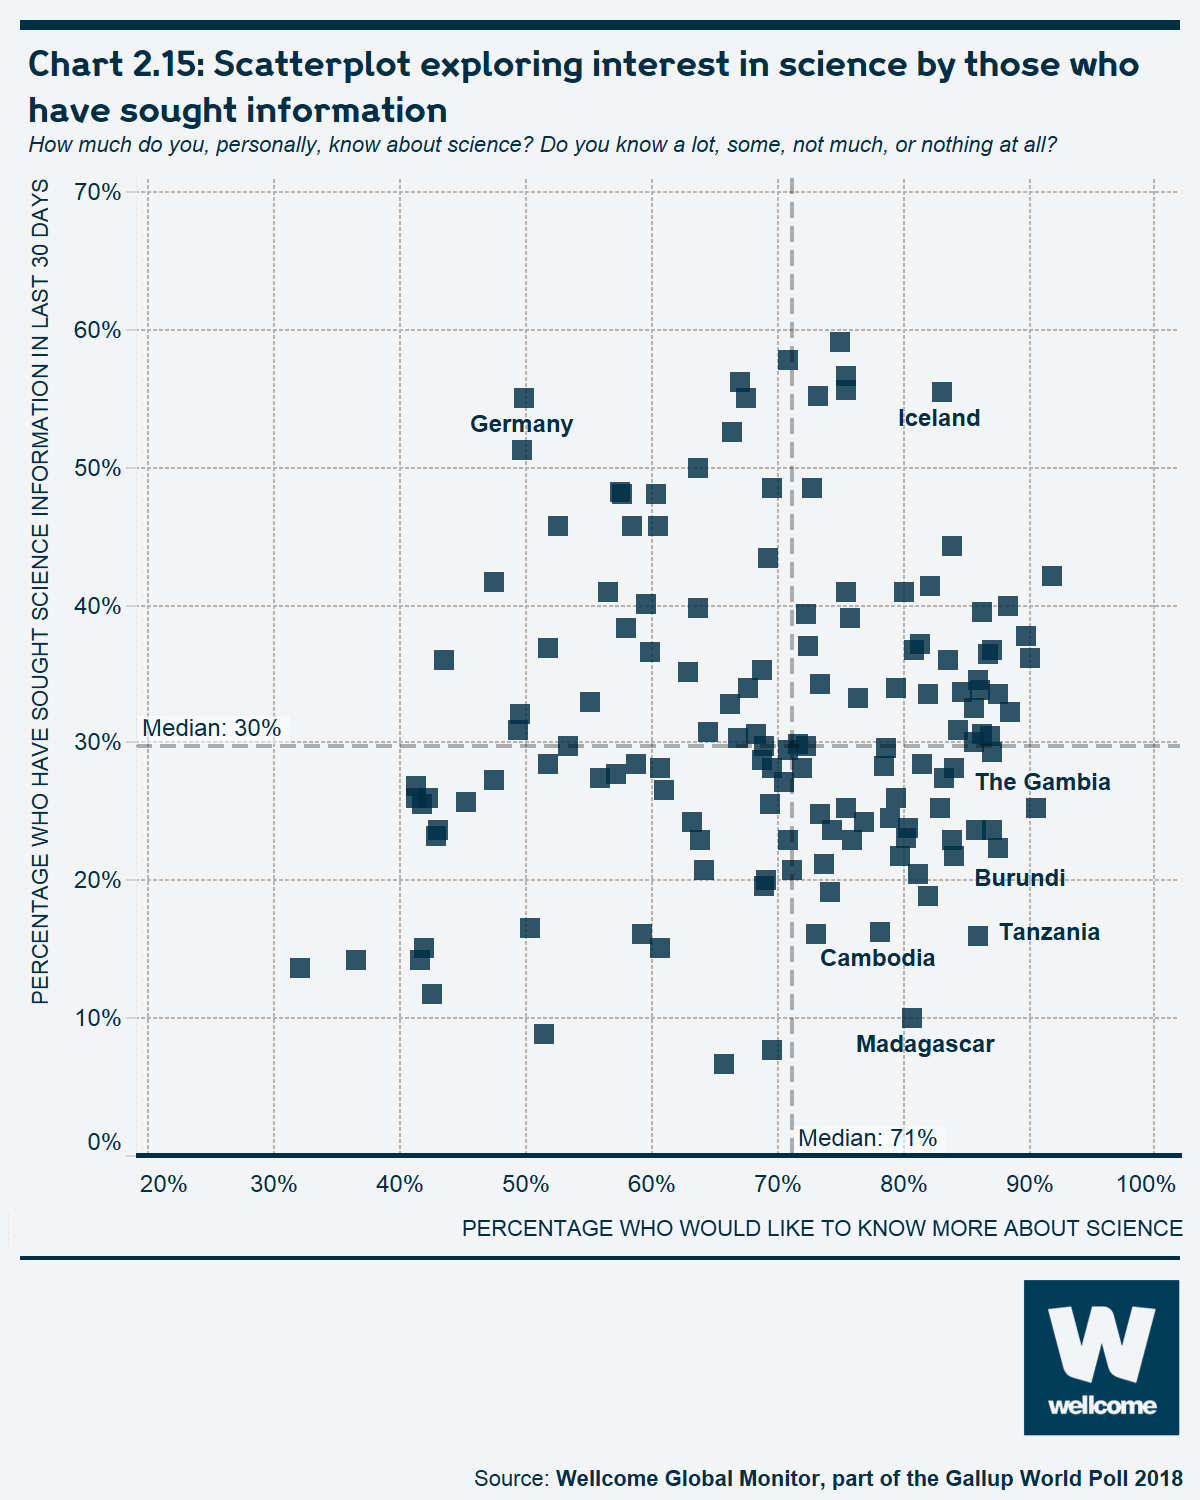
People in almost every country included in the study are more likely to say they would like to learn more about science or health than they are to say they have tried to get information about these topics in the past 30 days (the only exceptions are Germany and Switzerland, where the two percentages are similar).
Comparing results from these items worldwide gives some idea of the countries and regions where there is a considerable gap between the percentage of people who said they want to learn more about science and the percentage of people who said they recently sought information about science.
In many countries, people are more likely to express interest in science than to seek information about it.
In Chart 2.15, countries in the lower right quadrant are those in which people are more likely than the global average to want more science information but less likely than average to have sought it out. Most are populations with low average formal education levels, living in information-poor environments, such as Madagascar, Tanzania, Cambodia, The Gambia and Burundi. 'Social desirability'26 effect notwithstanding, the results indicate that in many countries where people currently have relatively low access to science education, they are nonetheless interested in learning more about science. In addition, it may be the case that as people were being interviewed about a subject they knew relatively little about, the 'engagement' effect of being interviewed about the topic may have encouraged some people to say that they were interested in learning more about it.
Chart 2.15: Scatterplot exploring interest in science by those who have sought information

See the interactive version of this chart.
Special focus: gender differences in perceived science knowledge and education
An increasingly important challenge facing the scientific community is whether both women and men are able to engage equally in science, or if women face barriers that men do not.27 This section will focus on gender differences in perceived self-assessed scientific knowledge, educational exposure to science, as well as accessing information on science and health.
Men are significantly more likely than women to say they know 'some' or 'a lot' about science
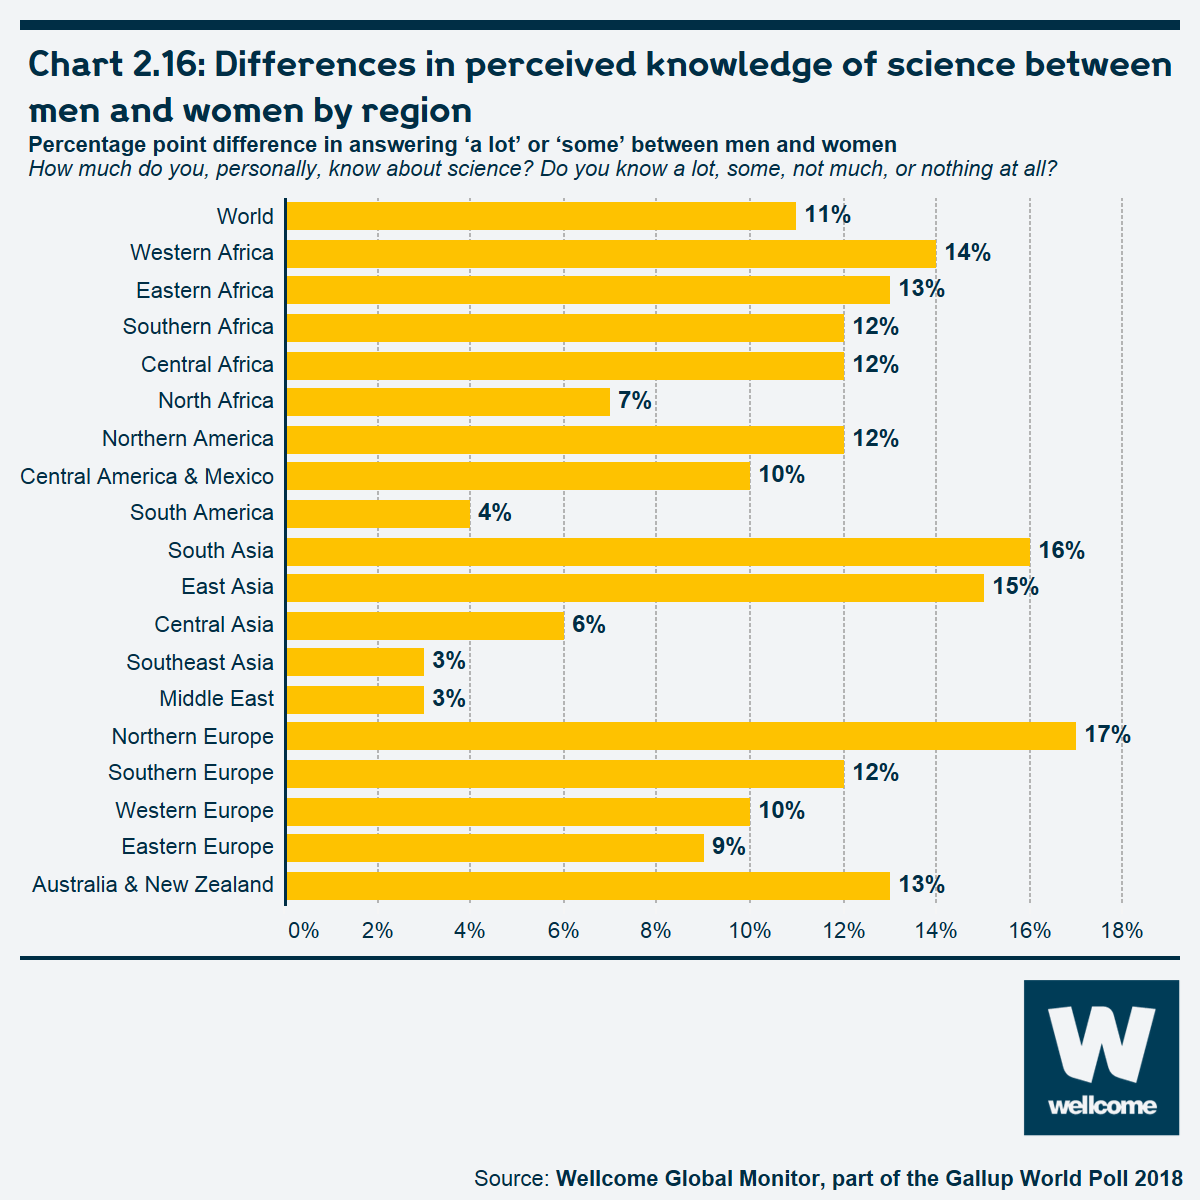
In nearly every region of the world, men are significantly more likely than women to say they know 'some' or 'a lot' about science. At 17 points, this gap is largest in Northern Europe, where 75% of men say they know at least 'some' science versus 58% of women there who say the same. Other regions with a sizeable gender gap in perceived knowledge of science include South Asia (16 points), East Asia (15 points), Western Africa (14 points), Australia and New Zealand (13 points) and Eastern Africa (13 points).
The gender gap in self-assessed knowledge is negligible in just three areas – the Middle East (gap of just 3 points), South America (a 4-point gap) and Southeast Asia (a 3-point gap).
Chart 2.16: Differences in perceived knowledge of science between men and women by region
See the interactive version of this chart.
Gender gap in self-assessed science knowledge persists even across education groups
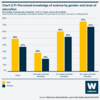
The gender gap in self-assessed science knowledge persists even when accounting for educational attainment. Overall, 49% of men worldwide say they know 'some' or 'a lot' about science, compared to 38% of women. Looking at the data by education narrows this gap somewhat, but in each group, women remain significantly less likely than men to say they know 'some' or 'a lot' about science.
Chart 2.17: Perceived knowledge of science by gender and level of education
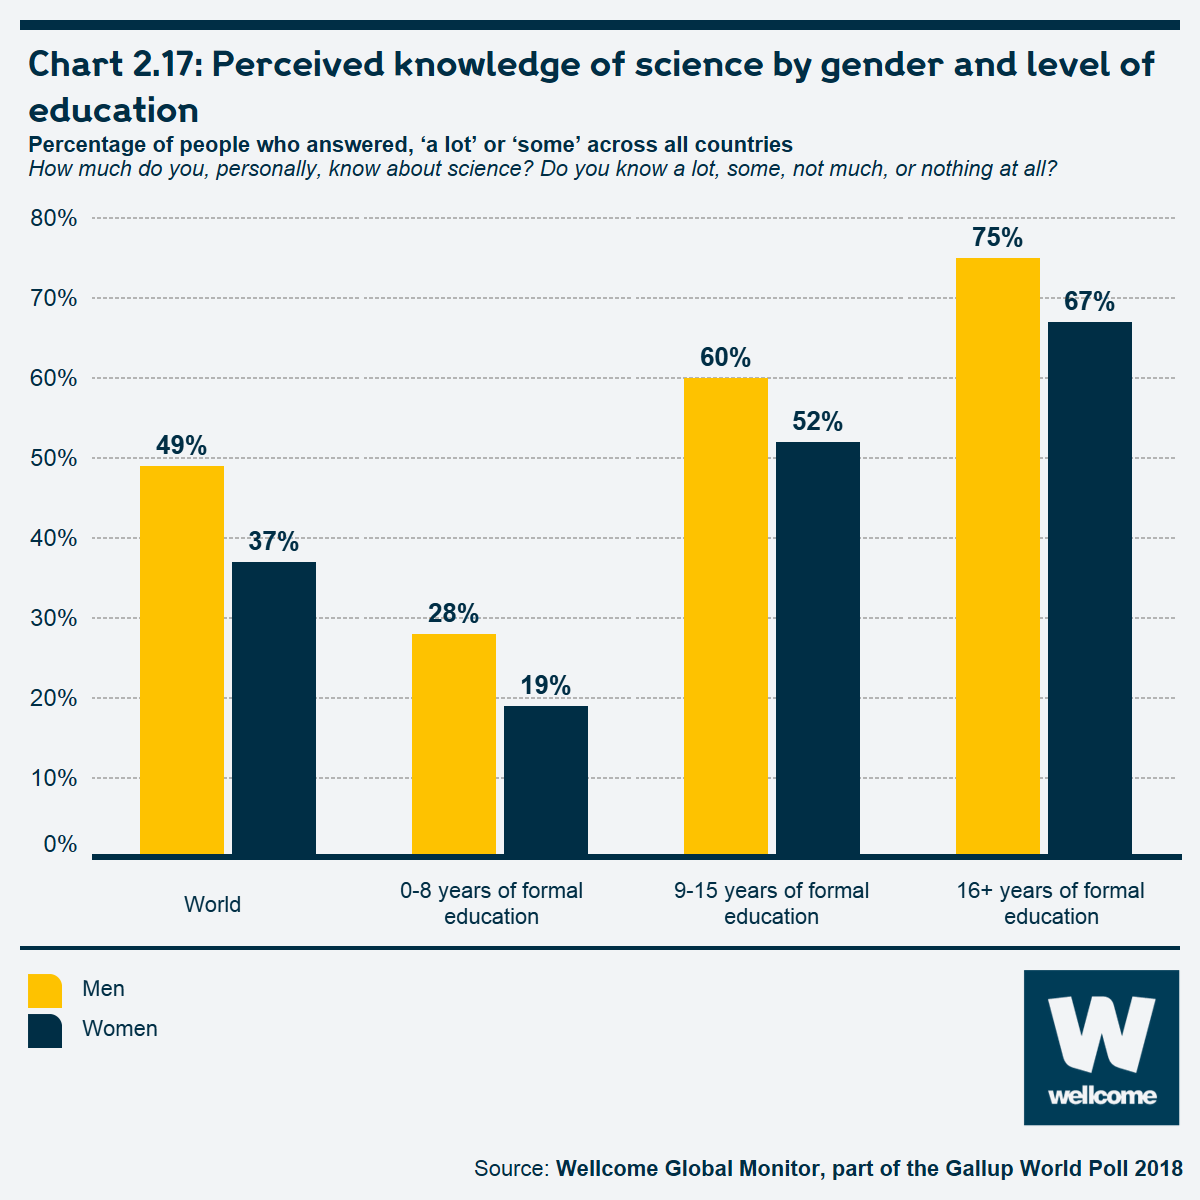
See the interactive version of this chart.
One possible explanation is that social biases in some countries lead girls to have less exposure than boys to science classes and programmes in school.28 However, the Wellcome Global Monitor does not offer support for this idea; among people worldwide in the upper two education categories, women are not meaningfully less likely than men to say they learned about science in school. The gap is minor even among those with post-secondary education; 79% say they learned about science in college – including 80% of men and 77% of women.
Table 2.2: Reported levels of science education by levels of general education and gender
Percentage of people who said they learned about science in secondary school and college/university.
Have you, personally, ever learned about science at primary school secondary school, college or university?
| 9 to 15 years of education | 16 or more years of education | |||||
|---|---|---|---|---|---|---|
| Total | Men | Women | Total | Men | Women | |
| Learned about science in secondary school | 86% | 86% | 85% | 96% | 95% | 97% |
| Learned about science at college/university | 25% | 26% | 24% | 79% | 80% | 77% |
Given the lack of major differences in science education, other explanations for women’s lower likelihood to say they have at least 'some' knowledge about science compared to men may be related to other factors, such as social norms or levels of relative self-confidence (ie can be men overconfident, not just women underconfident).29
While women are less likely than men to seek science information, they are just as likely to seek health information
One-third of men globally (32%) say they have sought science information in the past 30 days, compared to about one-quarter of women (24%). This gender gap is present among countries in different regions and at different economic development levels. Regionally, the largest gaps can be found in both high-income regions (62% of men compared to 50% of women in Northern America, and 53% of men compared to 43% of women in Australia and New Zealand) and low-income regions (37% of men compared to 25% of women in Central America, and 32% of men compared to 20% of women in Eastern Africa).
Chart 2.18: People seeking science information by region and gender

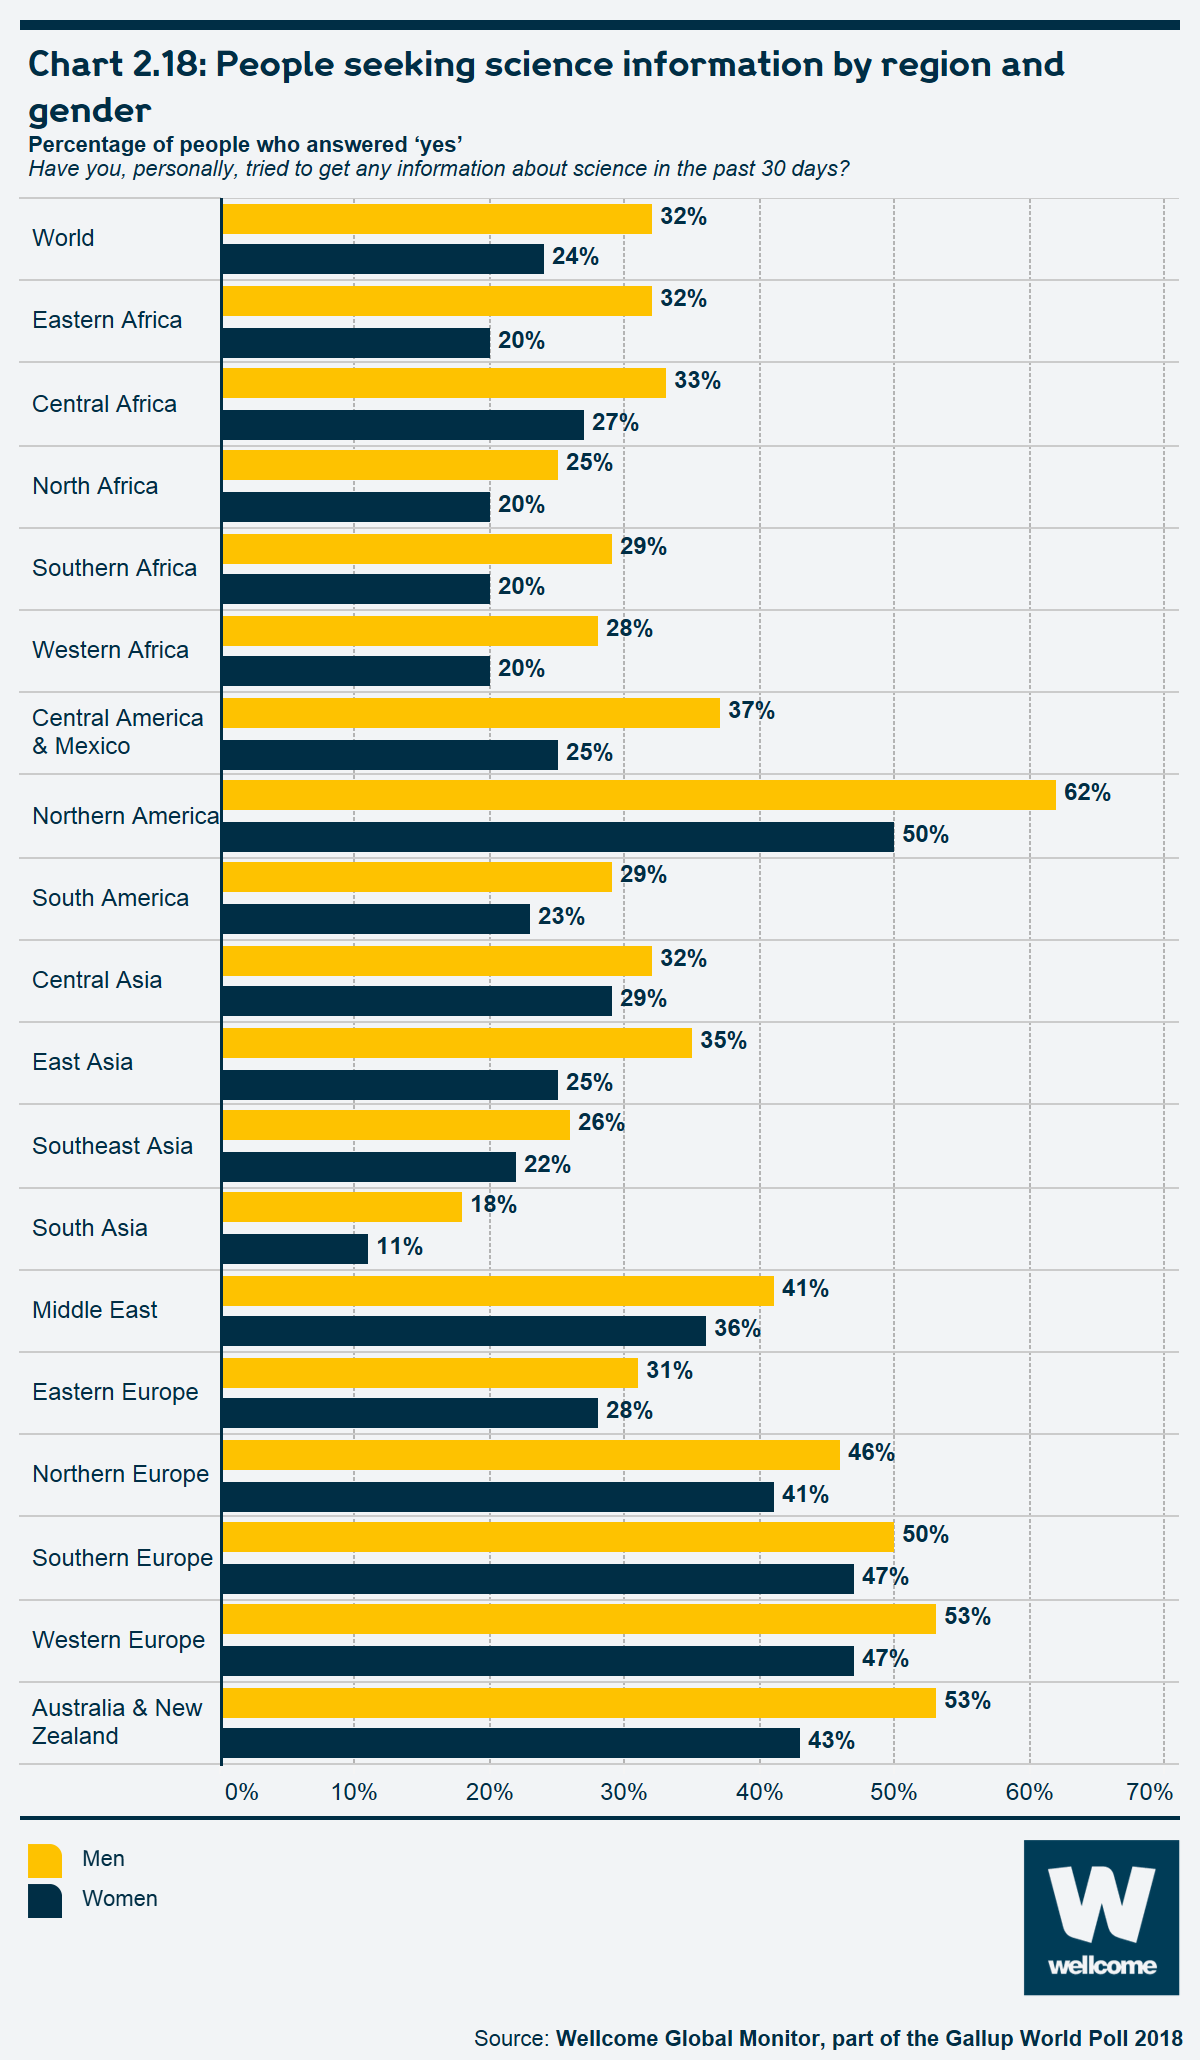
See the interactive version of this chart.
However, there is no significant gender gap in seeking health information. Men and women are similarly likely at the global level to say they have tried to get such information in the past 30 days, at 40% and 42%, respectively. As Chart 2.19 shows, the larger regional differences favour women – most notably, 34% of men vs. 51% of women in Eastern Europe.
Chart 2.19: People seeking health information by region and gender

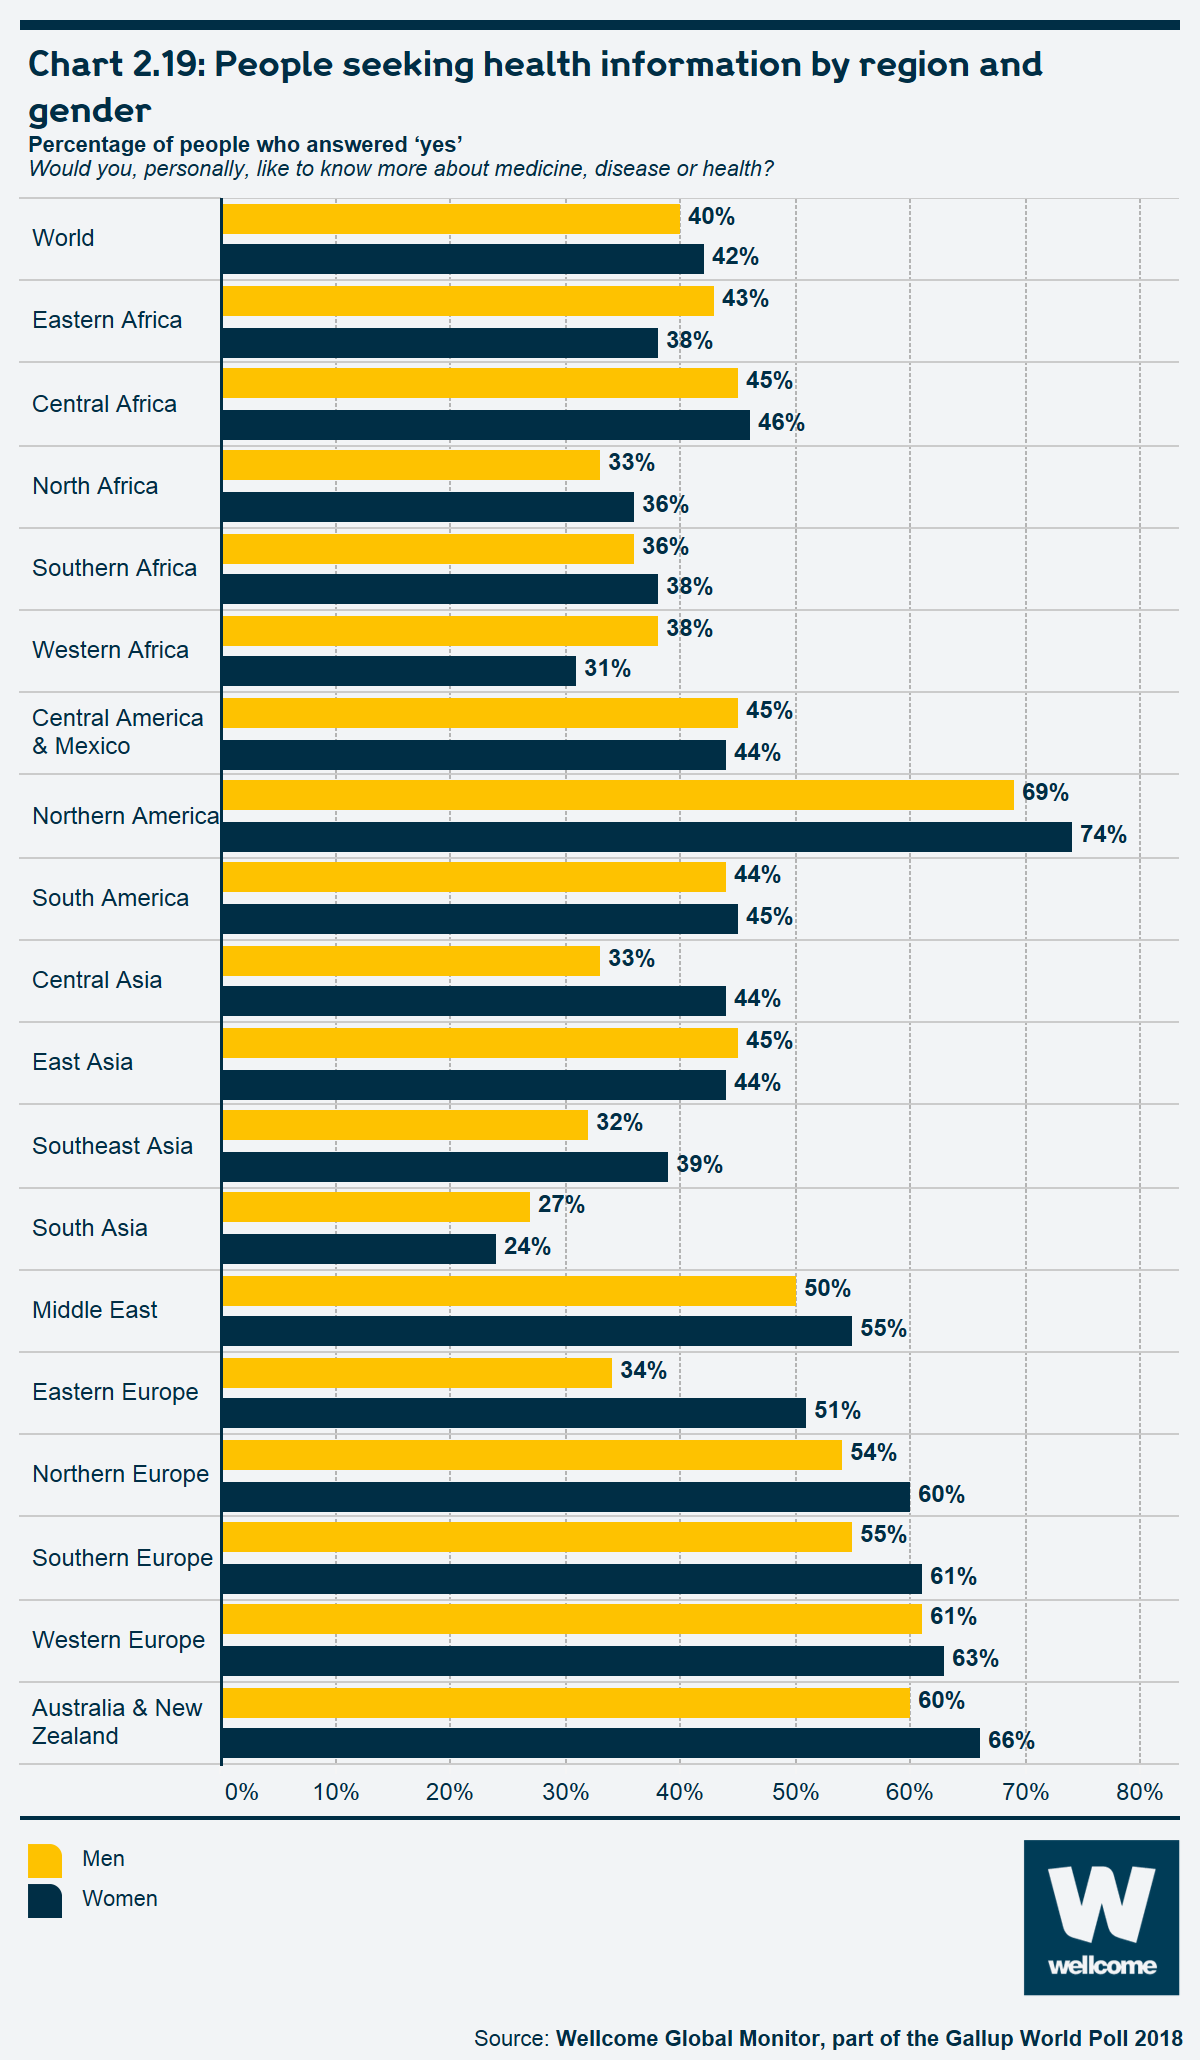
See the interactive version of this chart.
Conclusion
Wellcome Global Monitor shows there is an appetite across the world for learning more about science, suggesting engagement activities will usually be widely valued. The benefit of science education also shines through: more education is associated with greater perceived knowledge about science, as well as greater trust in scientists. Younger people, who tend to have had greater (or more recent) access to educational opportunities than older generations, are also more likely than their elders to say they know about science.
As important as education is to knowing about and understanding science, it does not explain all of the variations seen between regions, suggesting that a range of other social or cultural factors also influence how we think about the concept of 'science'. People are more likely to seek information about health than science, which reinforces the need to engage people more with science and research.
Gender differences in how people rate their knowledge and understanding of science are concerning. In nearly every region, men tend to rate their knowledge of science significantly higher than women do, even when they have had the same level of science education. This implies that either men tend to overstate their knowledge or women tend to understate theirs – or both. Does this reflect an entrenched bias in most societies that science is a more ‘male’ endeavour? What can be learned from those few regions where men and women rate their knowledge more equally? Wellcome Global Monitor cannot answer these questions, but any gender disparity in relation to science will strongly affect who participates in scientific research – and who benefits from it.
If any interactive charts are slow to load, try later or contact our team at wgm@wellcome.org.
Endnotes
- Respondents were asked 'On this survey, when I say 'science' I mean the understanding we have about the world from observation and testing. When I say 'scientists' I mean people who study the Planet Earth, nature and medicine, among other things. How much did you understand the meaning of 'science' and 'scientists' that was just read?'
- Wellcome Global Monitor Questionnaire Development Report: https://wellcome.org/sites/default/files/wellcome-global-monitor-quest... [accessed 4 June 2019]
- Science Council. Our definition of science. https://sciencecouncil.org/about-science/our-definition-of-science/ [accessed 24 May 2019]
- Sample I. What is this thing we call science? Here's one definition... The Guardian 2009 4 March. https://www.theguardian.com/science/blog/2009/mar/03/science-definition-council-francis-bacon [accessed 24 May 2019].
- Wellcome Global Monitor Questionnaire Development Report: https://wellcome.org/sites/default/files/wellcome-global-monitor-questionnaire-development-report_0.pdf [accessed 24 May 2019].
- According to the World Bank, gross domestic expenditures on research and development (GERD) 'includes both capital and current expenditures in the four main sectors: business enterprise, government, higher education and private non-profit. R & D covers basic research, applied research and experimental development.'
- The correlation between a country’s GERD and the percentage of people who said they understood 'some' or 'all' of the survey-provided definition of science is slightly below 0.5, as measured by Pearson’s correlation coefficient. Pearson’s correlation coefficient can take a range of values between -1 (indicating a perfect negative linear relationship) and +1 (a perfect positive linear relationship). A value of 0 indicates no relationship. Correlation coefficients between 0.3 and 0.5, as in this case, are generally considered to show a positive relationship of medium strength.
- Liu, et al. Comparing the Public Understanding of Science across China and Europe. In Bauer MW, et al, eds. The Culture of Science: How the Public Relates to Science Across the Globe. London: Routledge; 2012.
- UNESCO. UNESCO Science Report, Towards 2030: Executive Summary. Paris: UNESCO; 2015. https://unesdoc.unesco.org/ark:/48223/pf0000235407 [accessed 16 May 2019].
- Raina, D. Revisiting Social Theory and History of Science in Early Modern South Asia and Colonial India. Extrême-Orient Extrême-Occident 2013, 36 (2), 191-210.
- Khan, GJ et al. Alternative medicine; the tendency of using complimentary alternative medicine in patients of different hospitals of Lahore, Pakistan. Professional Med J 2014; 21(6):1178–84.
- The Wellcome Global Monitor asked 'How much do you trust each of the following? Traditional healers in this country? Do you trust them a lot, some, not much, or not at all?' The results of this question are discussed in Chapter 3 of this report.
- Entradas M. Science and the public: The public understanding of science and its measurements. Portuguese Journal of Social Science 2015 14(1), 71–85.
- Shukla R, Bauer MW. Construction and Validation of Science Culture Index: Results from Comparative Analysis of Engagement, Knowledge and Attitudes to Science: India and Europe. NCAER Working Papers 100. National Council of Applied Economic Research2009 http://www.ncaer.org/publication_details.php [accessed 24 May 2019].
- Othman M, Muijs D. Educational quality differences in a middle-income country: the urban-rural gap in Malaysian primary schools. School Effectiveness and School Improvement 2013;24(1):1–18.
- Nguyen T et al. The effects of perceived and actual financial knowledge on regular personal savings: Case of Vietnam. Journal of International Studies 2017;10(2):278–91.
- Radecki CM, Jaccard J. Perceptions of Knowledge, Actual Knowledge, and Information Search Behavior. Journal of Experimental Social Psychology 1995; 31:107–38
- World Economic Forum. The Global Competitiveness Report 2018. World Economic Forum: 2018. https://www.weforum.org/reports/the-global-competitveness-report-2018 [accessed 24 May 2019].
- Kurman J. Why is Self-Enhancement Low in Certain Collectivist Cultures?: An Investigation of Two Competing Explanations. Journal of Cross-Cultural Psychology 2003;34(5):496–510. http://iaccp.org/sites/default/files/kurman_2003_0.pdf [accessed 24 May 2019].
- Heine SJ, et al. Is there a universal need for positive self-regard? Psychological Review 1999;106(4):766–94. https://www.ncbi.nlm.nih.gov/pubmed/10560328 [accessed 24 May 2019].
- UNICEF. Rwanda: Education. https://www.unicef.org/rwanda/education.html [accessed 24 May 2019].
- Bromme R, Goldman SR. The public’s bounded understanding of science. Educational Psychologist 2014;49(2):59–69.
- Chu JT, et al. How, When and Why People Seek Health Information Online: Qualitative Study in Hong Kong. NCBI, US National Library of Medicine, National Institutes of Health; 2017.
- Jacobs W, et al Alvares C (Reviewing Editor) Health information seeking in the digital age: An analysis of health information seeking behavior among US adults. Cogent Social Sciences 2017;3(1).
- Lavrakas PJ. Encyclopedia of survey research methods. Thousand Oaks, CA: Sage Publications, Inc; 2008. doi: 10.4135/9781412963947 http://methods.sagepub.com/reference/encyclopedia-of-survey-research-met... [accessed 24 May 2019].
- Scientific American. How to Fight Race and Gender Bias in Science [Editorial]. Scientific American 2014;311(4):12 https://www.scientificamerican.com/article/how-to-fight-race-and-gender-... [accessed 24 May 2019].
- Feeney MK. Why more women don’t win science Nobels. The Conversation 2018 6 October. http://theconversation.com/why-more-women-dont-win-science-nobels-104370 [accessed 24 May 2019].
- Notably, previous measures of scientific knowledge have found that women are more likely than men to say they do not know the answer to specific questions about scientific facts, controlling for education levels and other potentially confounding factors. Bauer, M, Falade BA. Public Understanding of Science Survey Research Around the World. In Bucchi M, Trench B. Routledge Handbook of Public Communication of Science and Technology, London: Routledge; 2008. 111–30.